

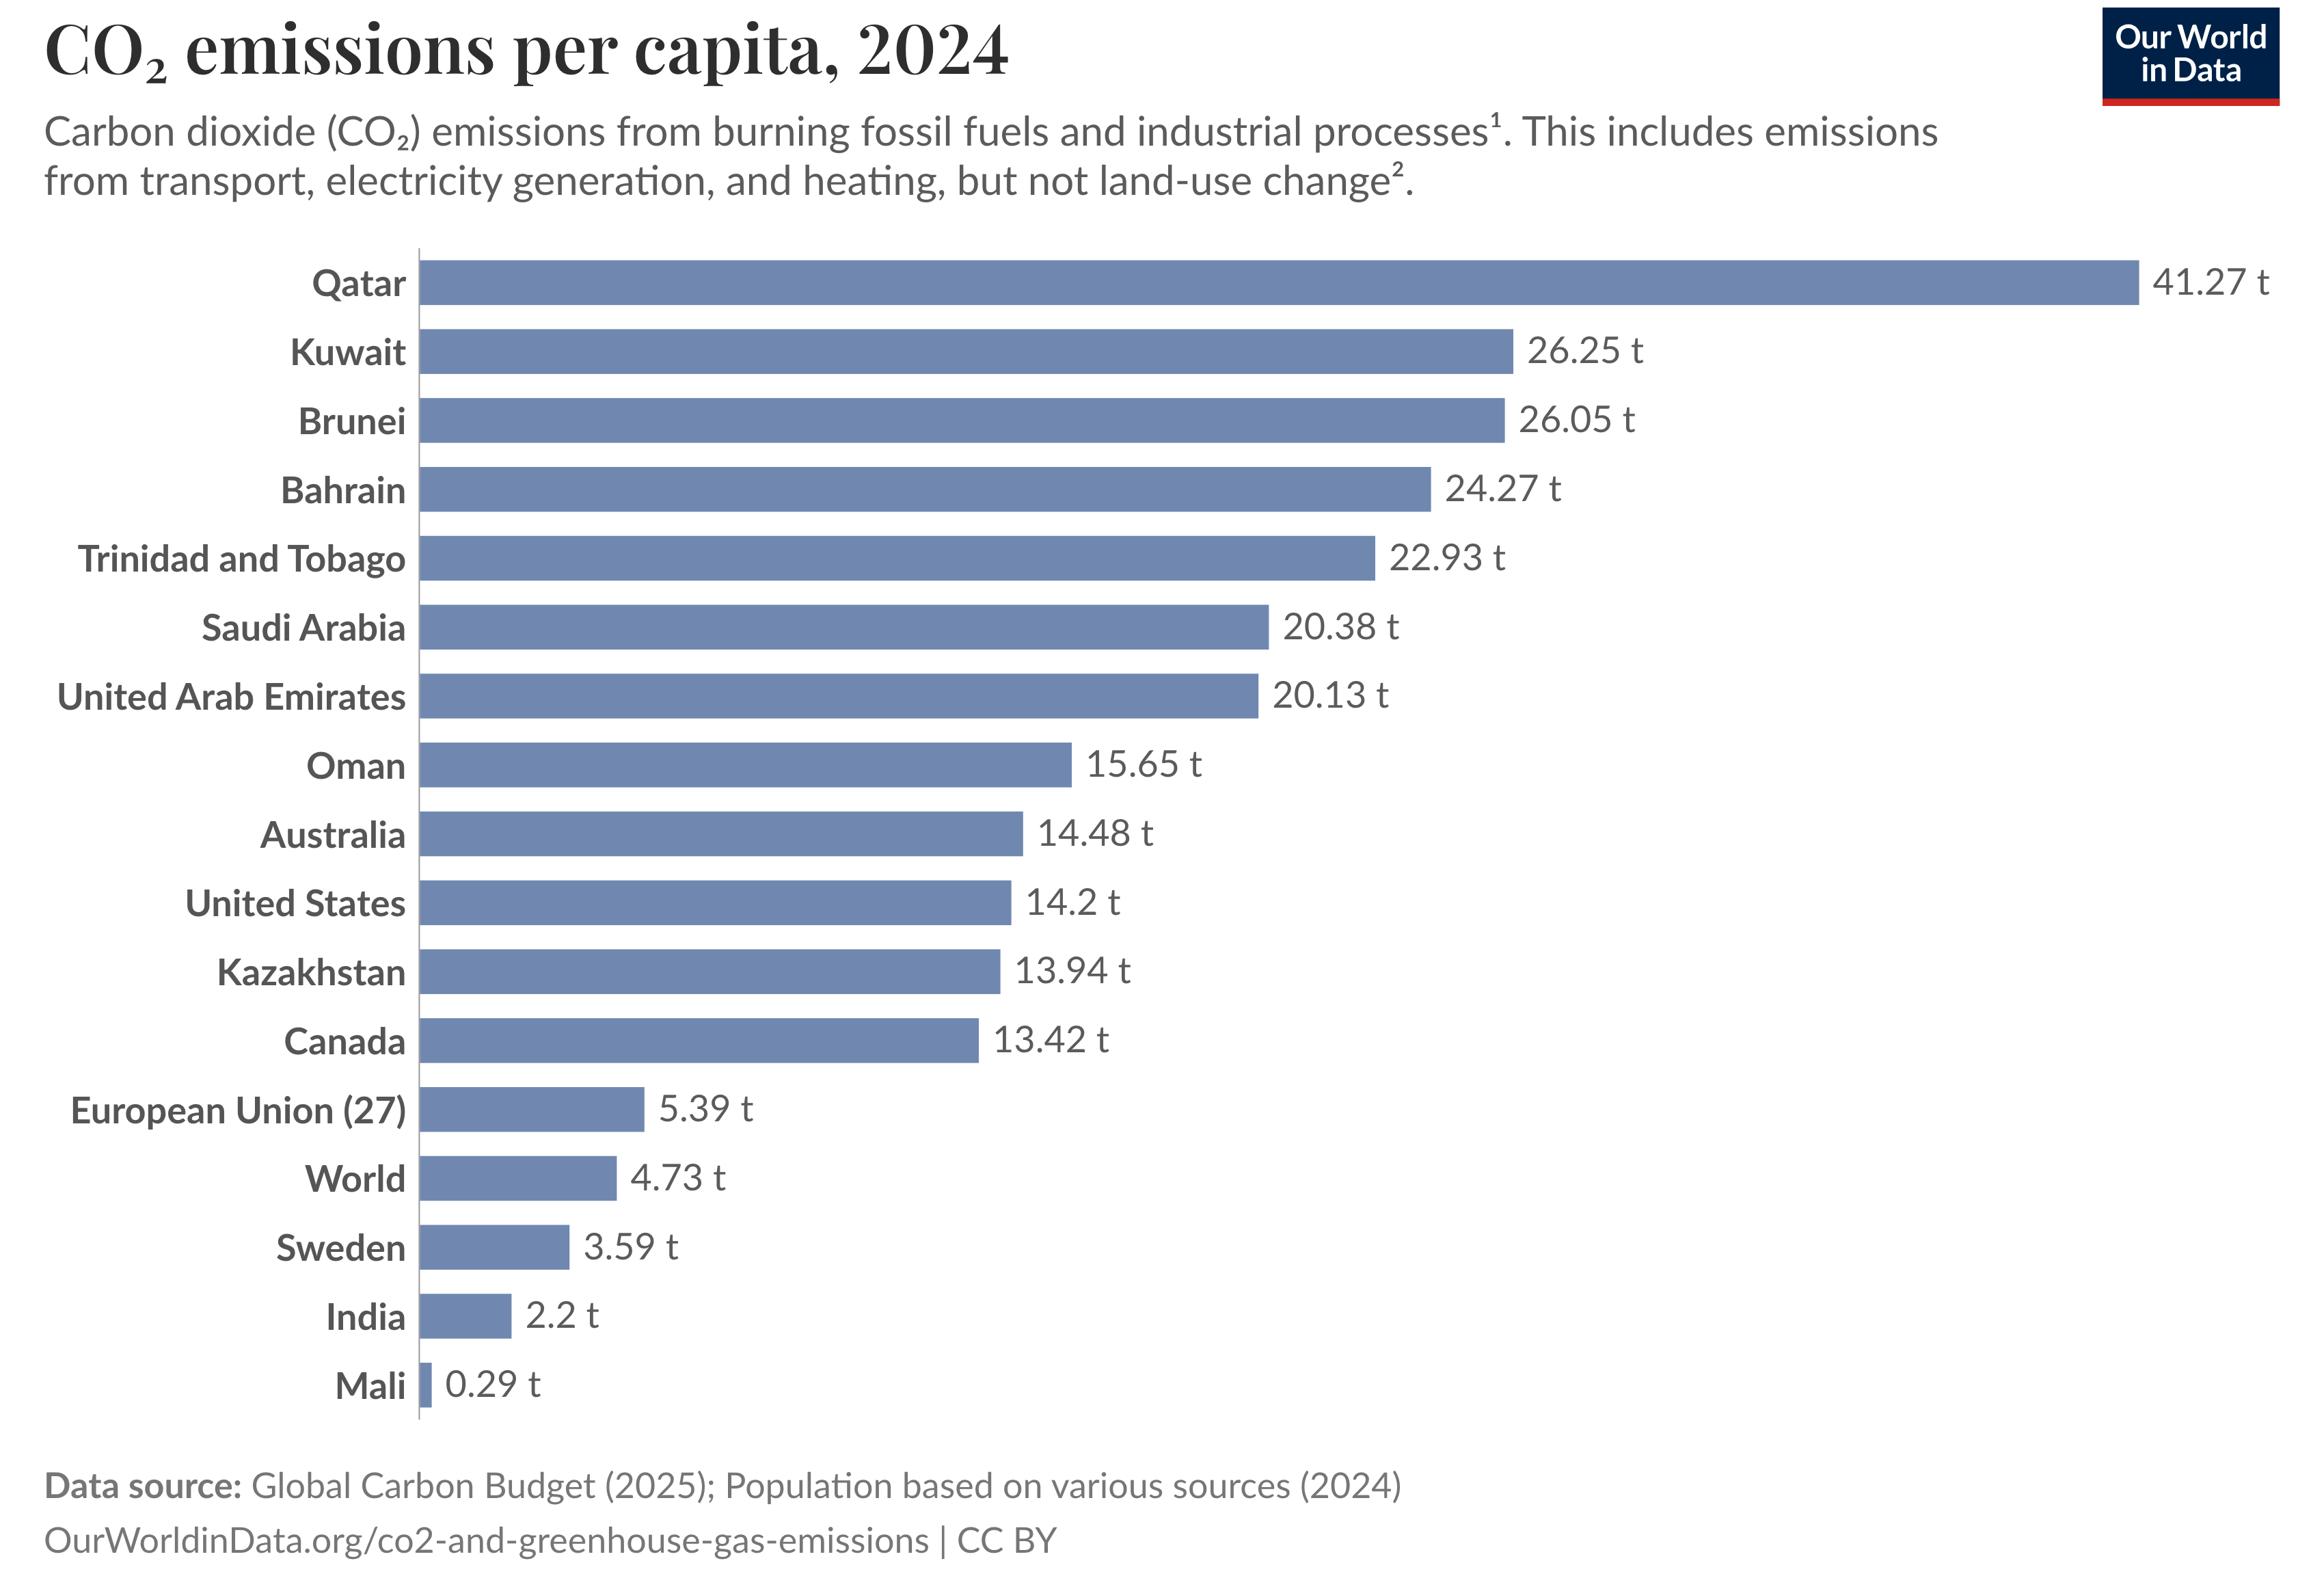
Worst 12 Countries by CO2 Emissions Per Capita

Some countries are closer to net zero than others. Per capita carbon emissions are low in places like Sweden, France, and Brazil that rely on low-carbon electricity generation (2.5 t - 3.5 t CO2/person). They are lower still in the world’s least developed countries in places like Sub-Saharan Africa and South Asia. (.25 t - 2.5 t CO2/person)
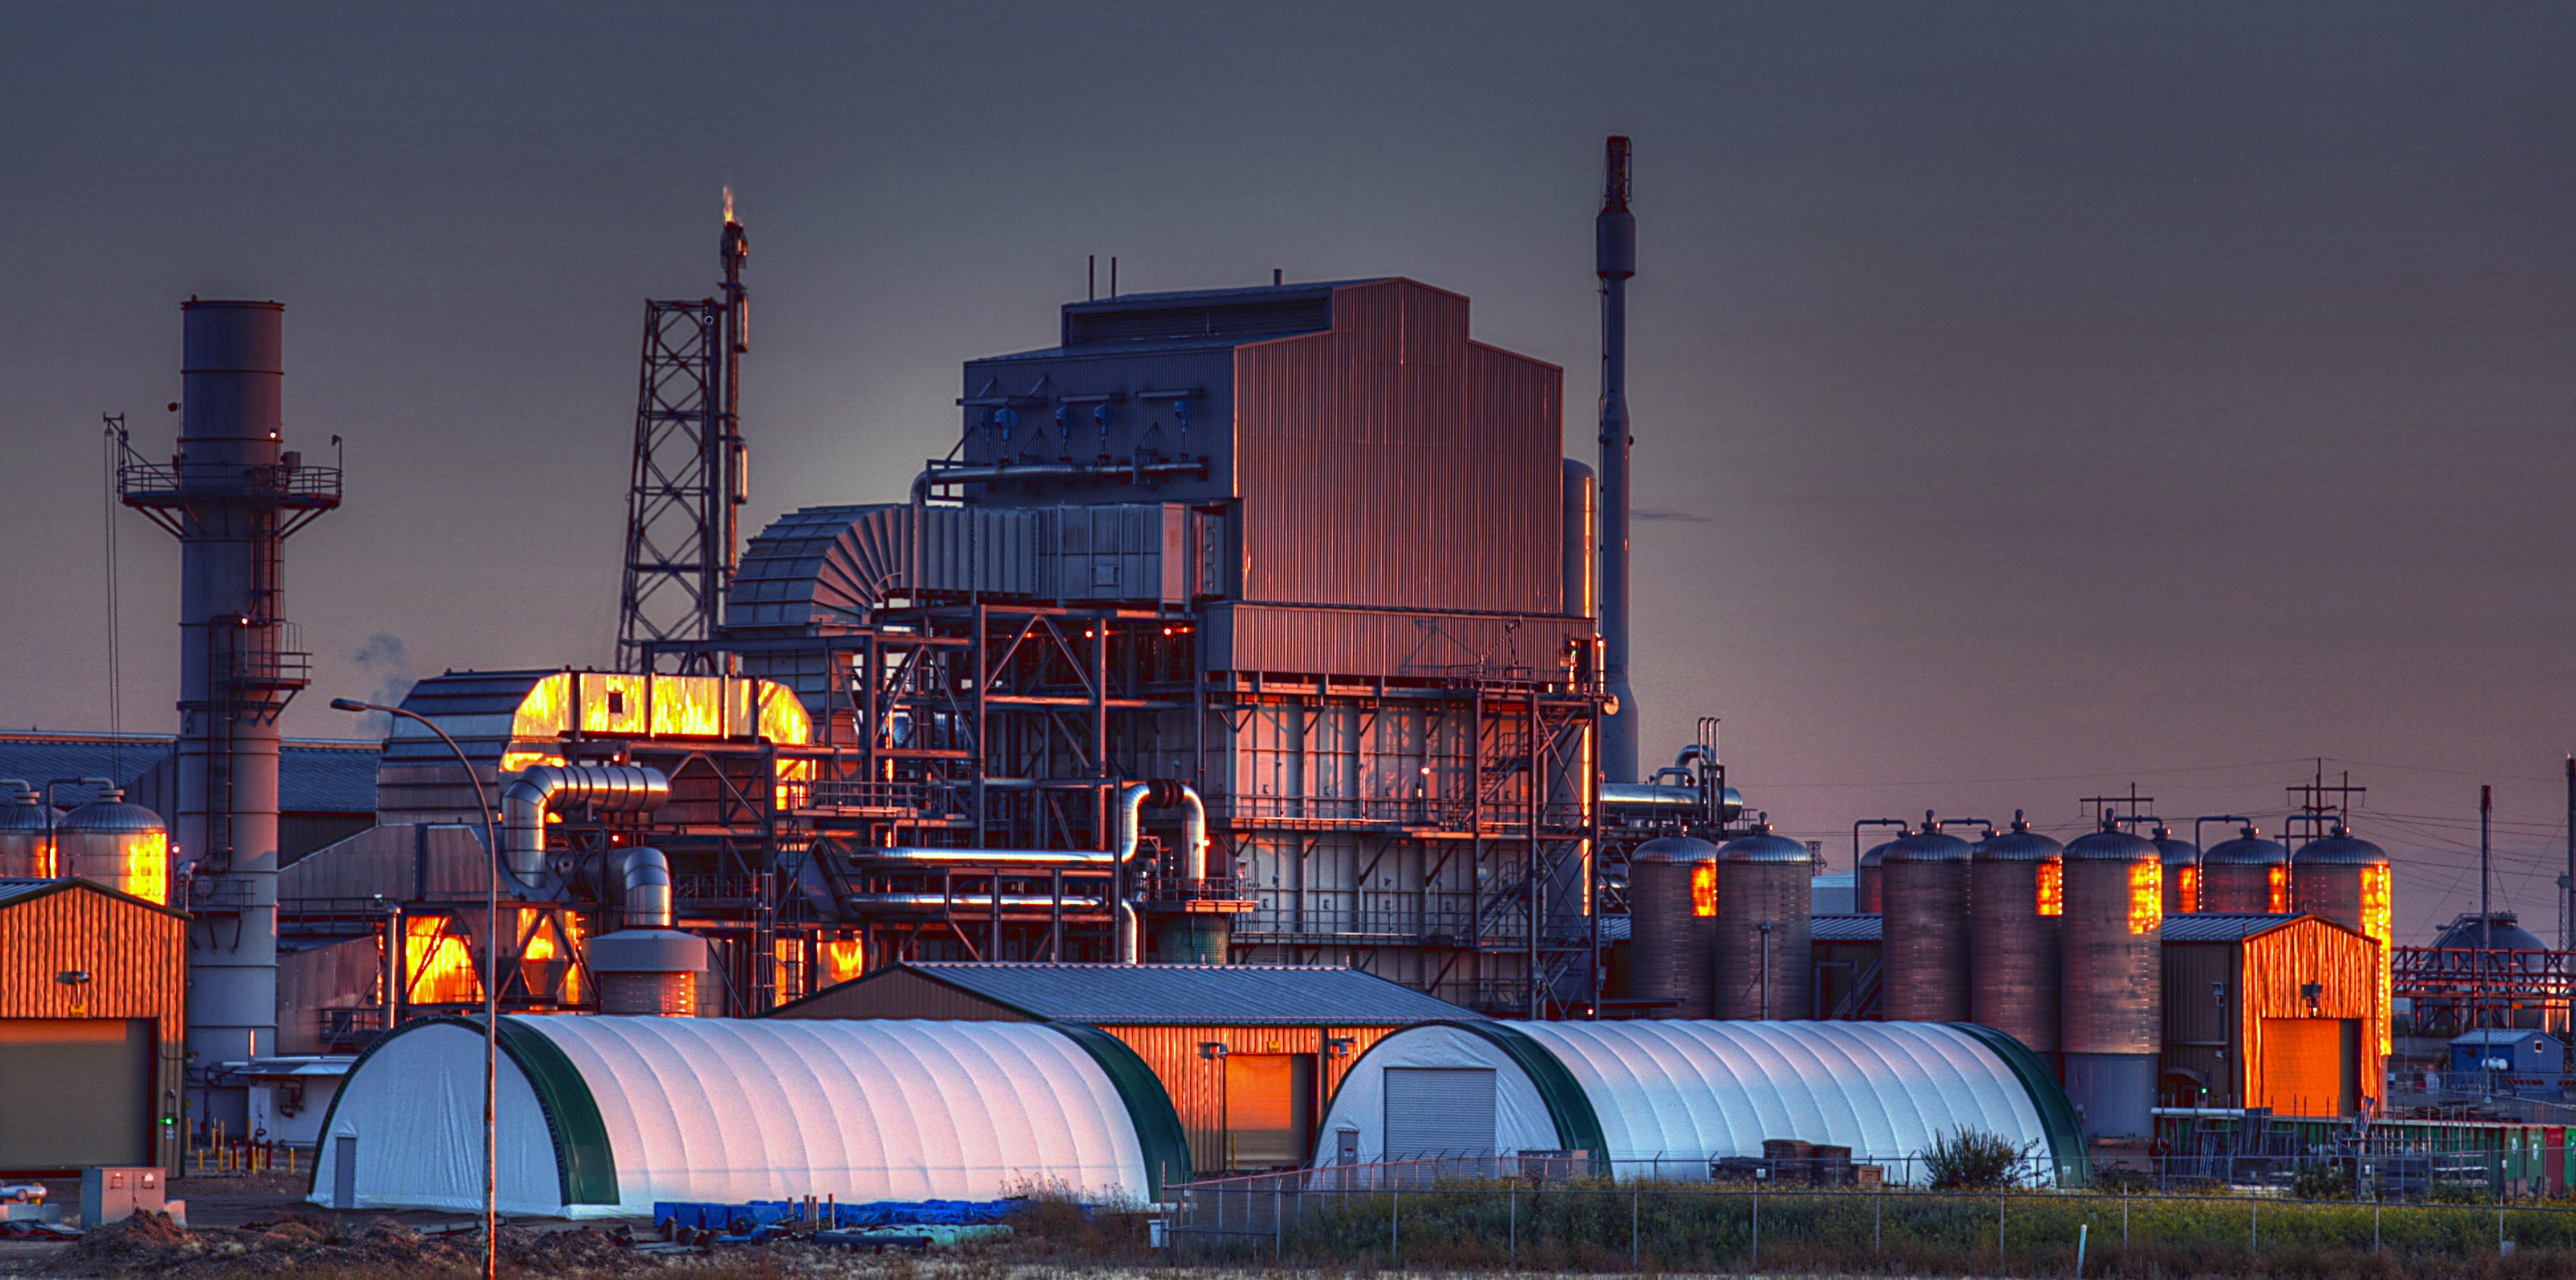
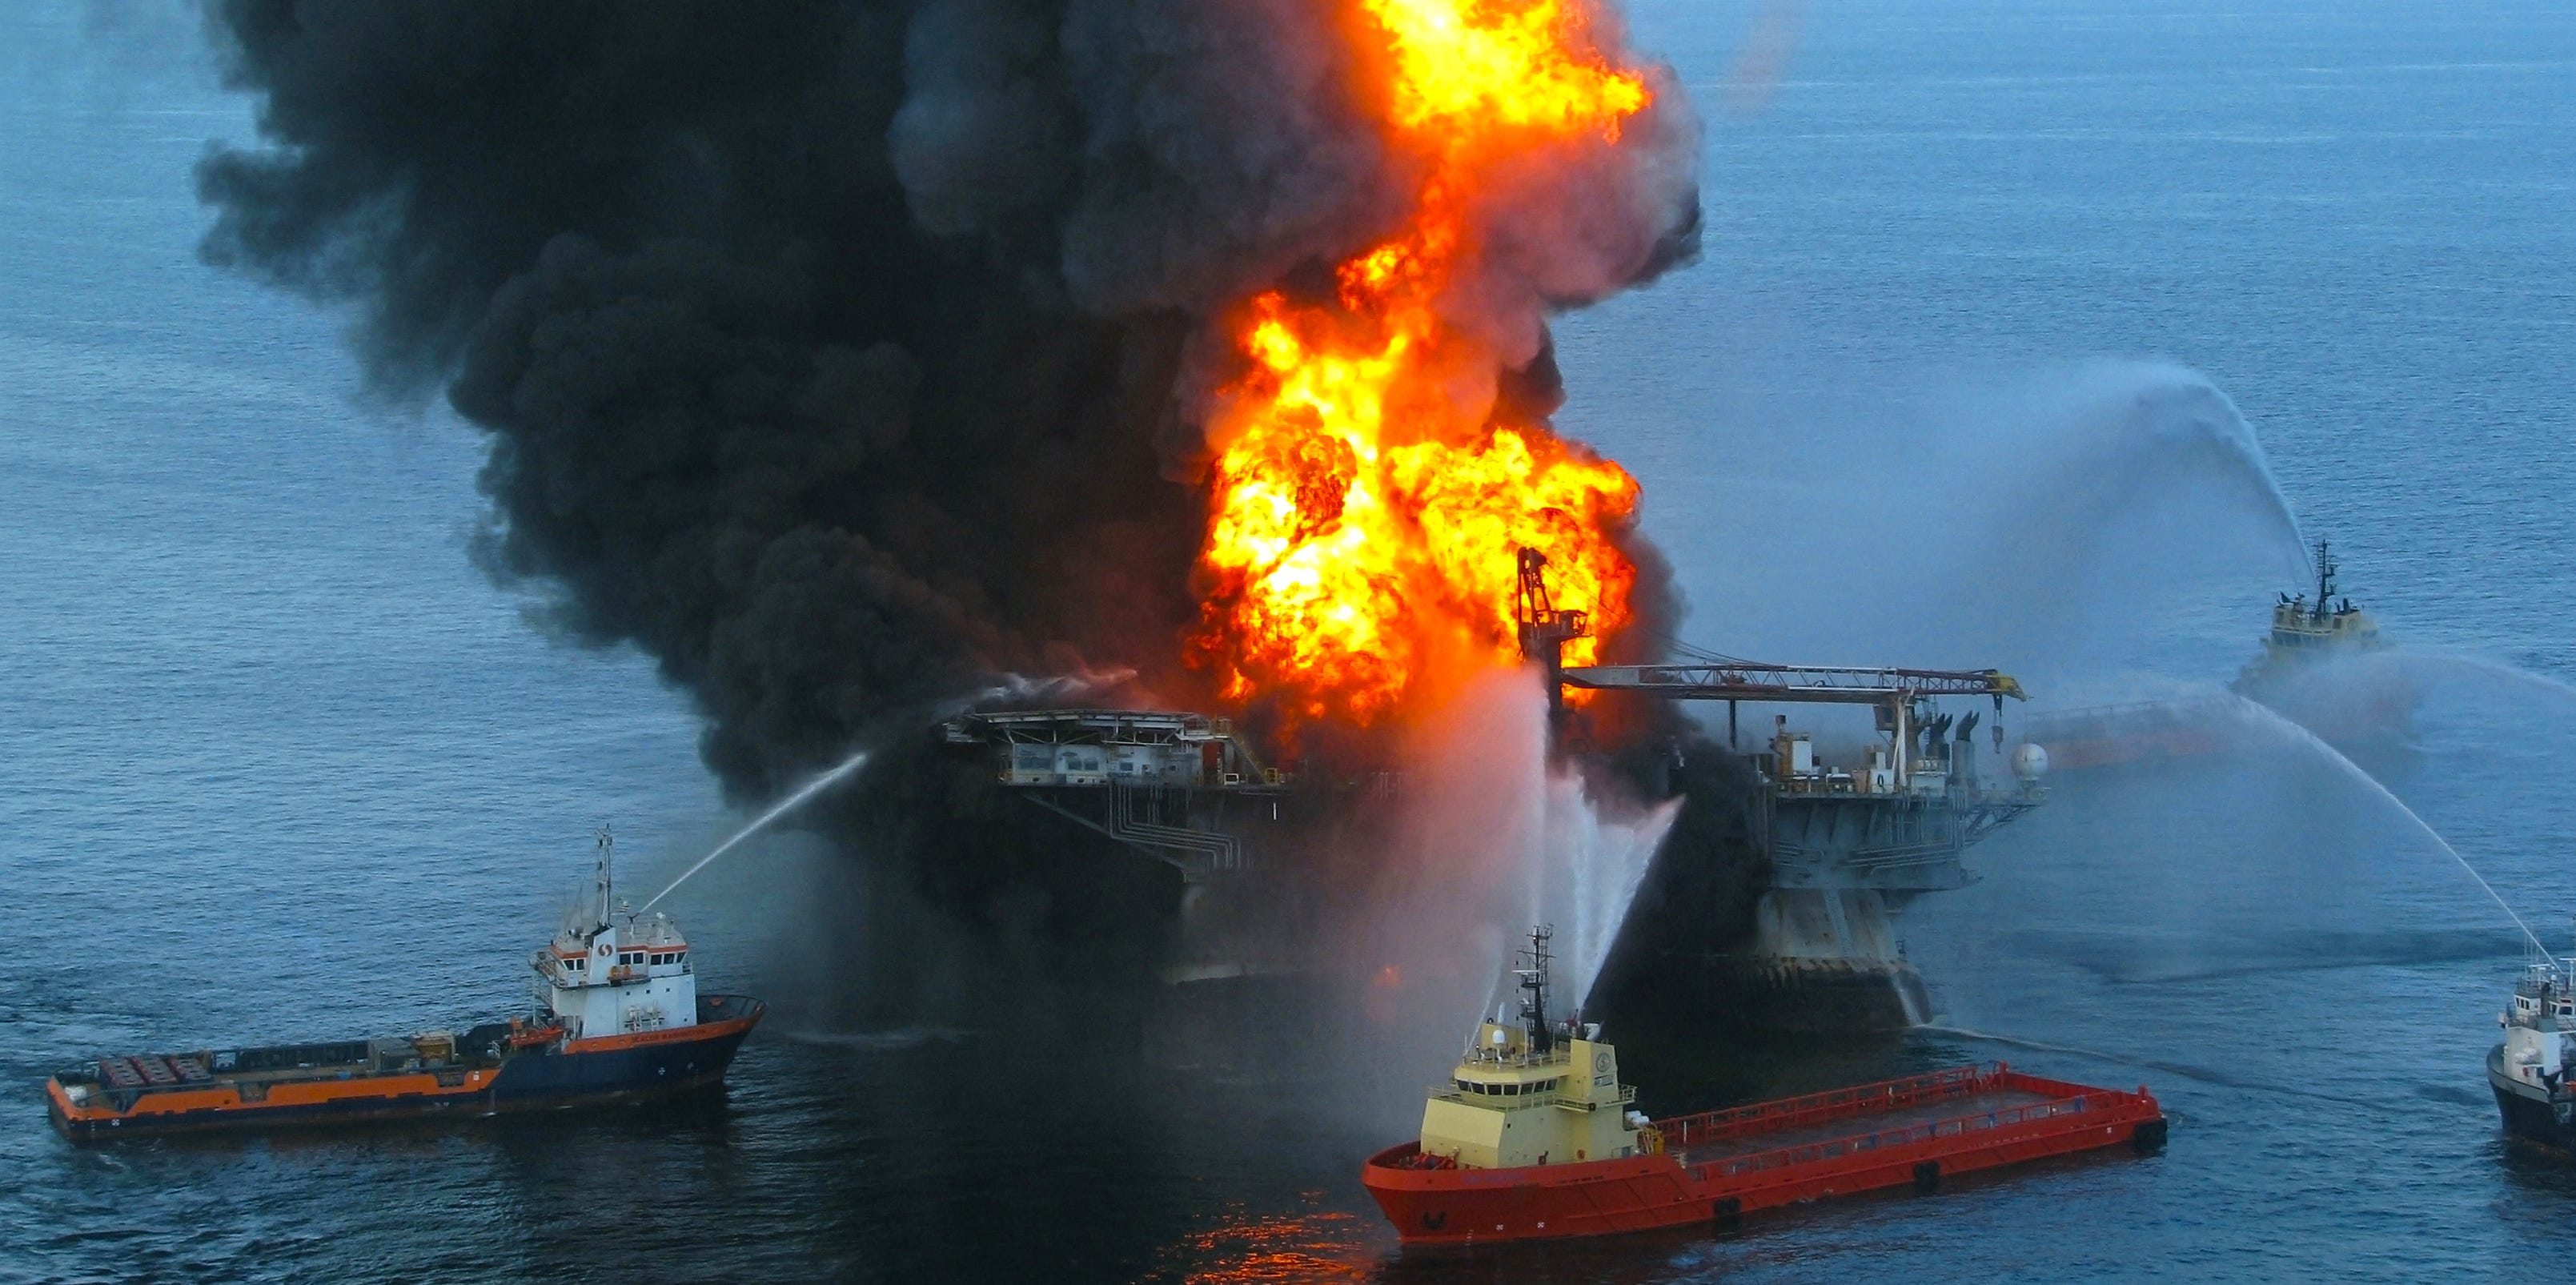
On the other side of the ledger are the world’s superemitters, which emit greater than 10 t CO2/person every year. The worst offenders are typically petrostates, both because they consume massive amounts of fossil fuels domestically and because the process of extracting oil and gas for export is carbon intensive.
Here are the worst twelve countries by CO2 emissions per capita1:
12. Canada
Annual Per Capita CO2: 13.42 t
Canada’s electricity is relatively clean, with nearly 80% coming from low-carbon sources like hydro, nuclear, and renewables. But the country is the fourth-largest oil producer in the world and the process emissions from the oil-and-gas industry catapult it onto the list of the world’s largest greenhouse gas emitters per capita.
11. Kazakhstan
Annual Per Capita CO2: 13.94 t
Coal accounts for over 50% of Kazakhstan’s electricity generation, and fossil gas another 30%. These power sector emissions combine with a huge oil and gas industry to place the developing Central Asian nation alongside the world’s worst emitters.
10. United States
Annual Per Capita CO2: 14.20 t
The United States is unique among the superemitters in that its large emissions profile derives more from anomalously high levels of energy consumption by consumers than from coal power sector emissions or oil and gas production. One factor is the large size of American homes, which drastically increases energy use. Another is extremely high light-vehicle emissions - surpassed only by Luxembourg and Palau on a per capita basis.
9. Australia
Annual Per Capita CO2: 14.48 t
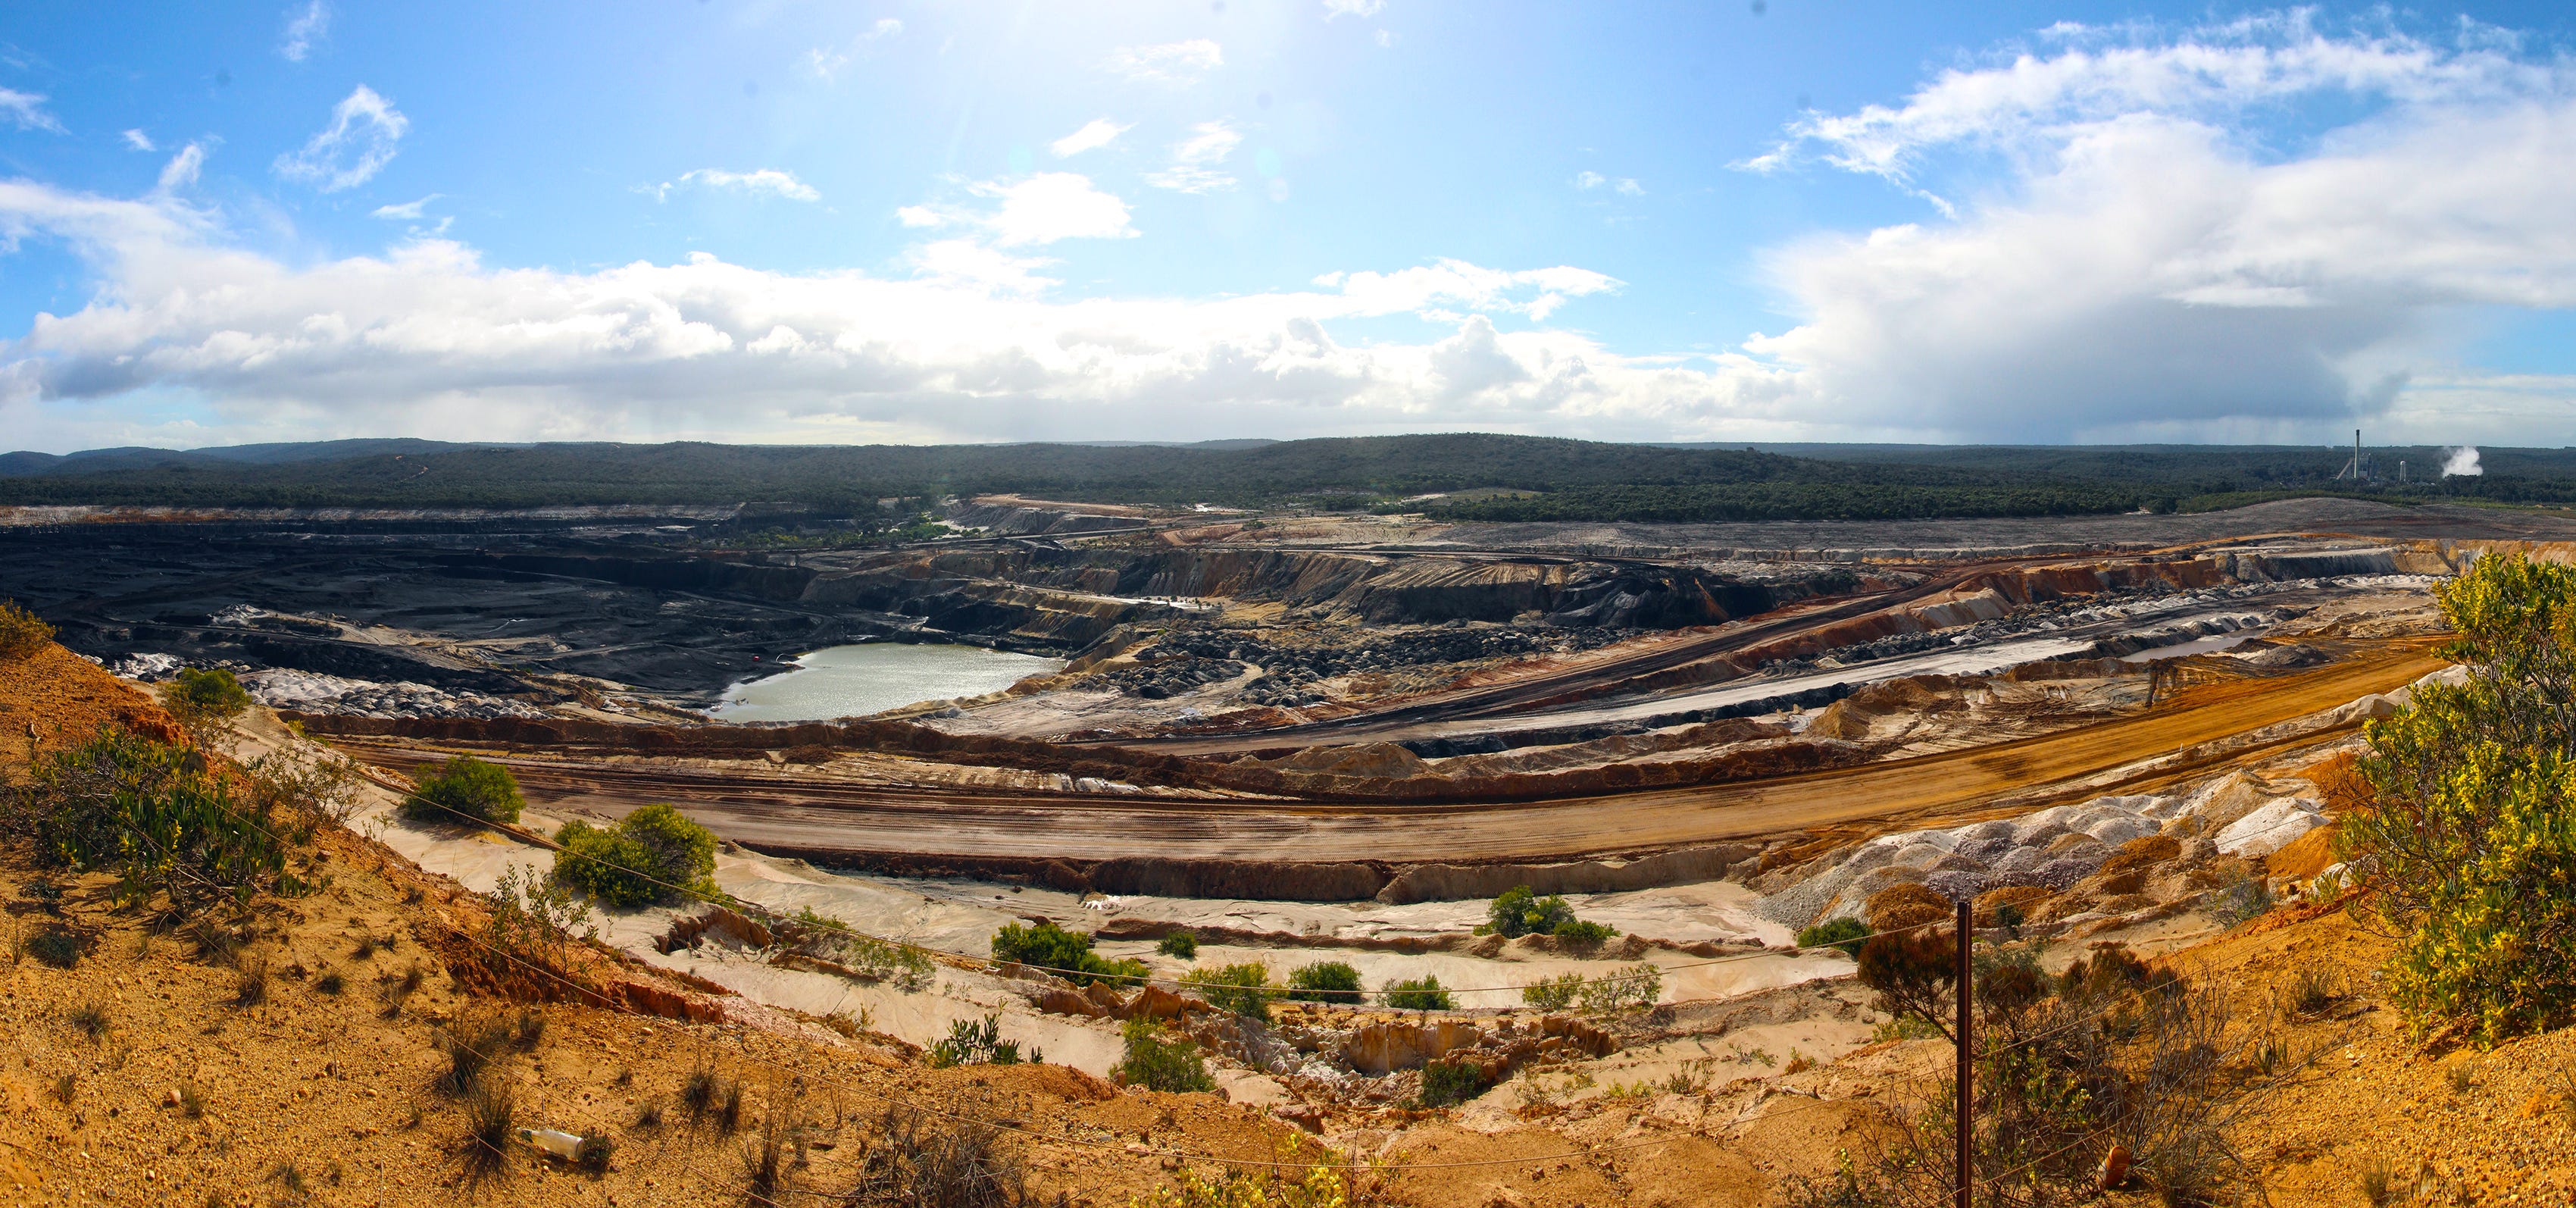
Coal is king of Australia’s CO2 emissions profile, contributing both through the power sector (45% of electricity generation in 2024) and the mining sector via fugitive emissions. Coal generation is rapidly being phased out, however, in favor of solar and wind. The Lucky Country’s emissions are consequently dropping more rapidly than its Anglophone peers.
8. Oman
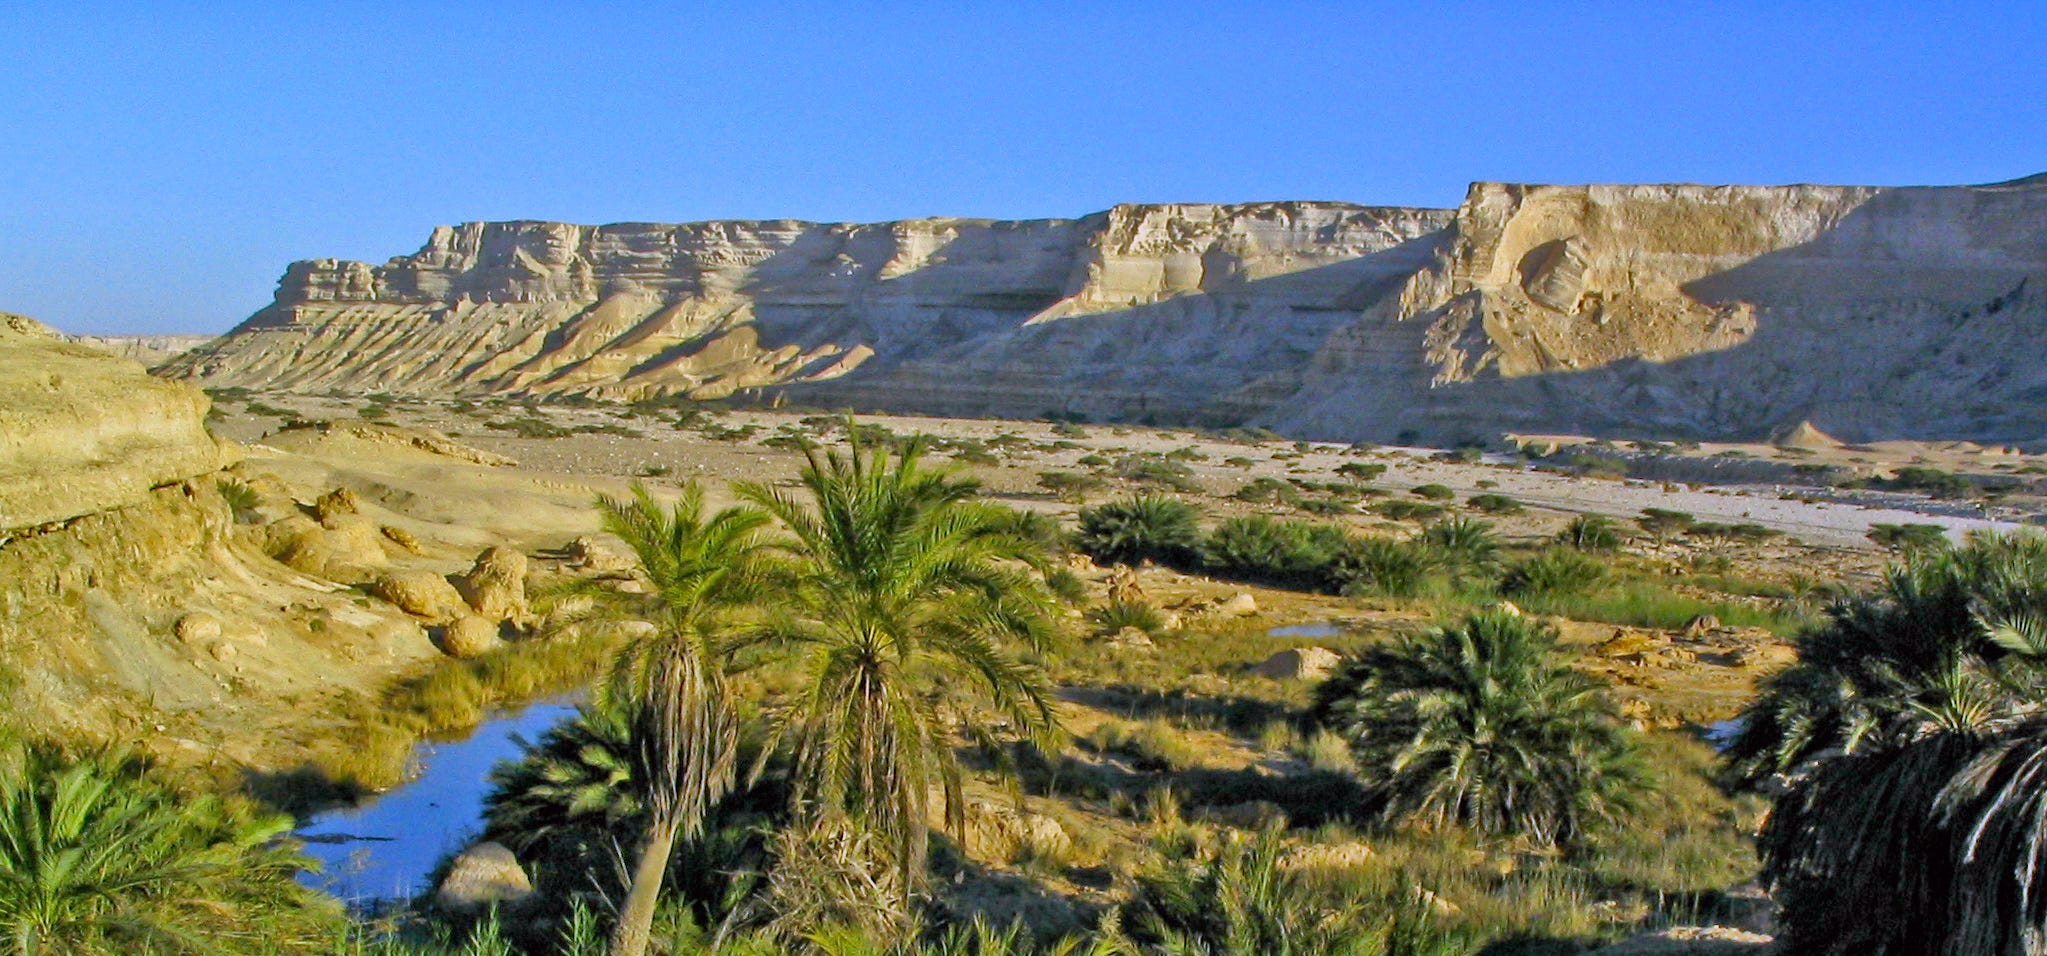
Annual Per Capita CO2: 15.65 t
In addition to being a significant exporter of fossil fuels, Oman’s entire economy is fueled by oil and gas. 93% of electricity generation comes from fossil gas and its transport sector emissions are higher per capita than Europe’s. The country has enormous solar potential, which is only now being explored.
Get Earthview in your inbox:
And consider a paid subscription to access premium content and support the work we do!
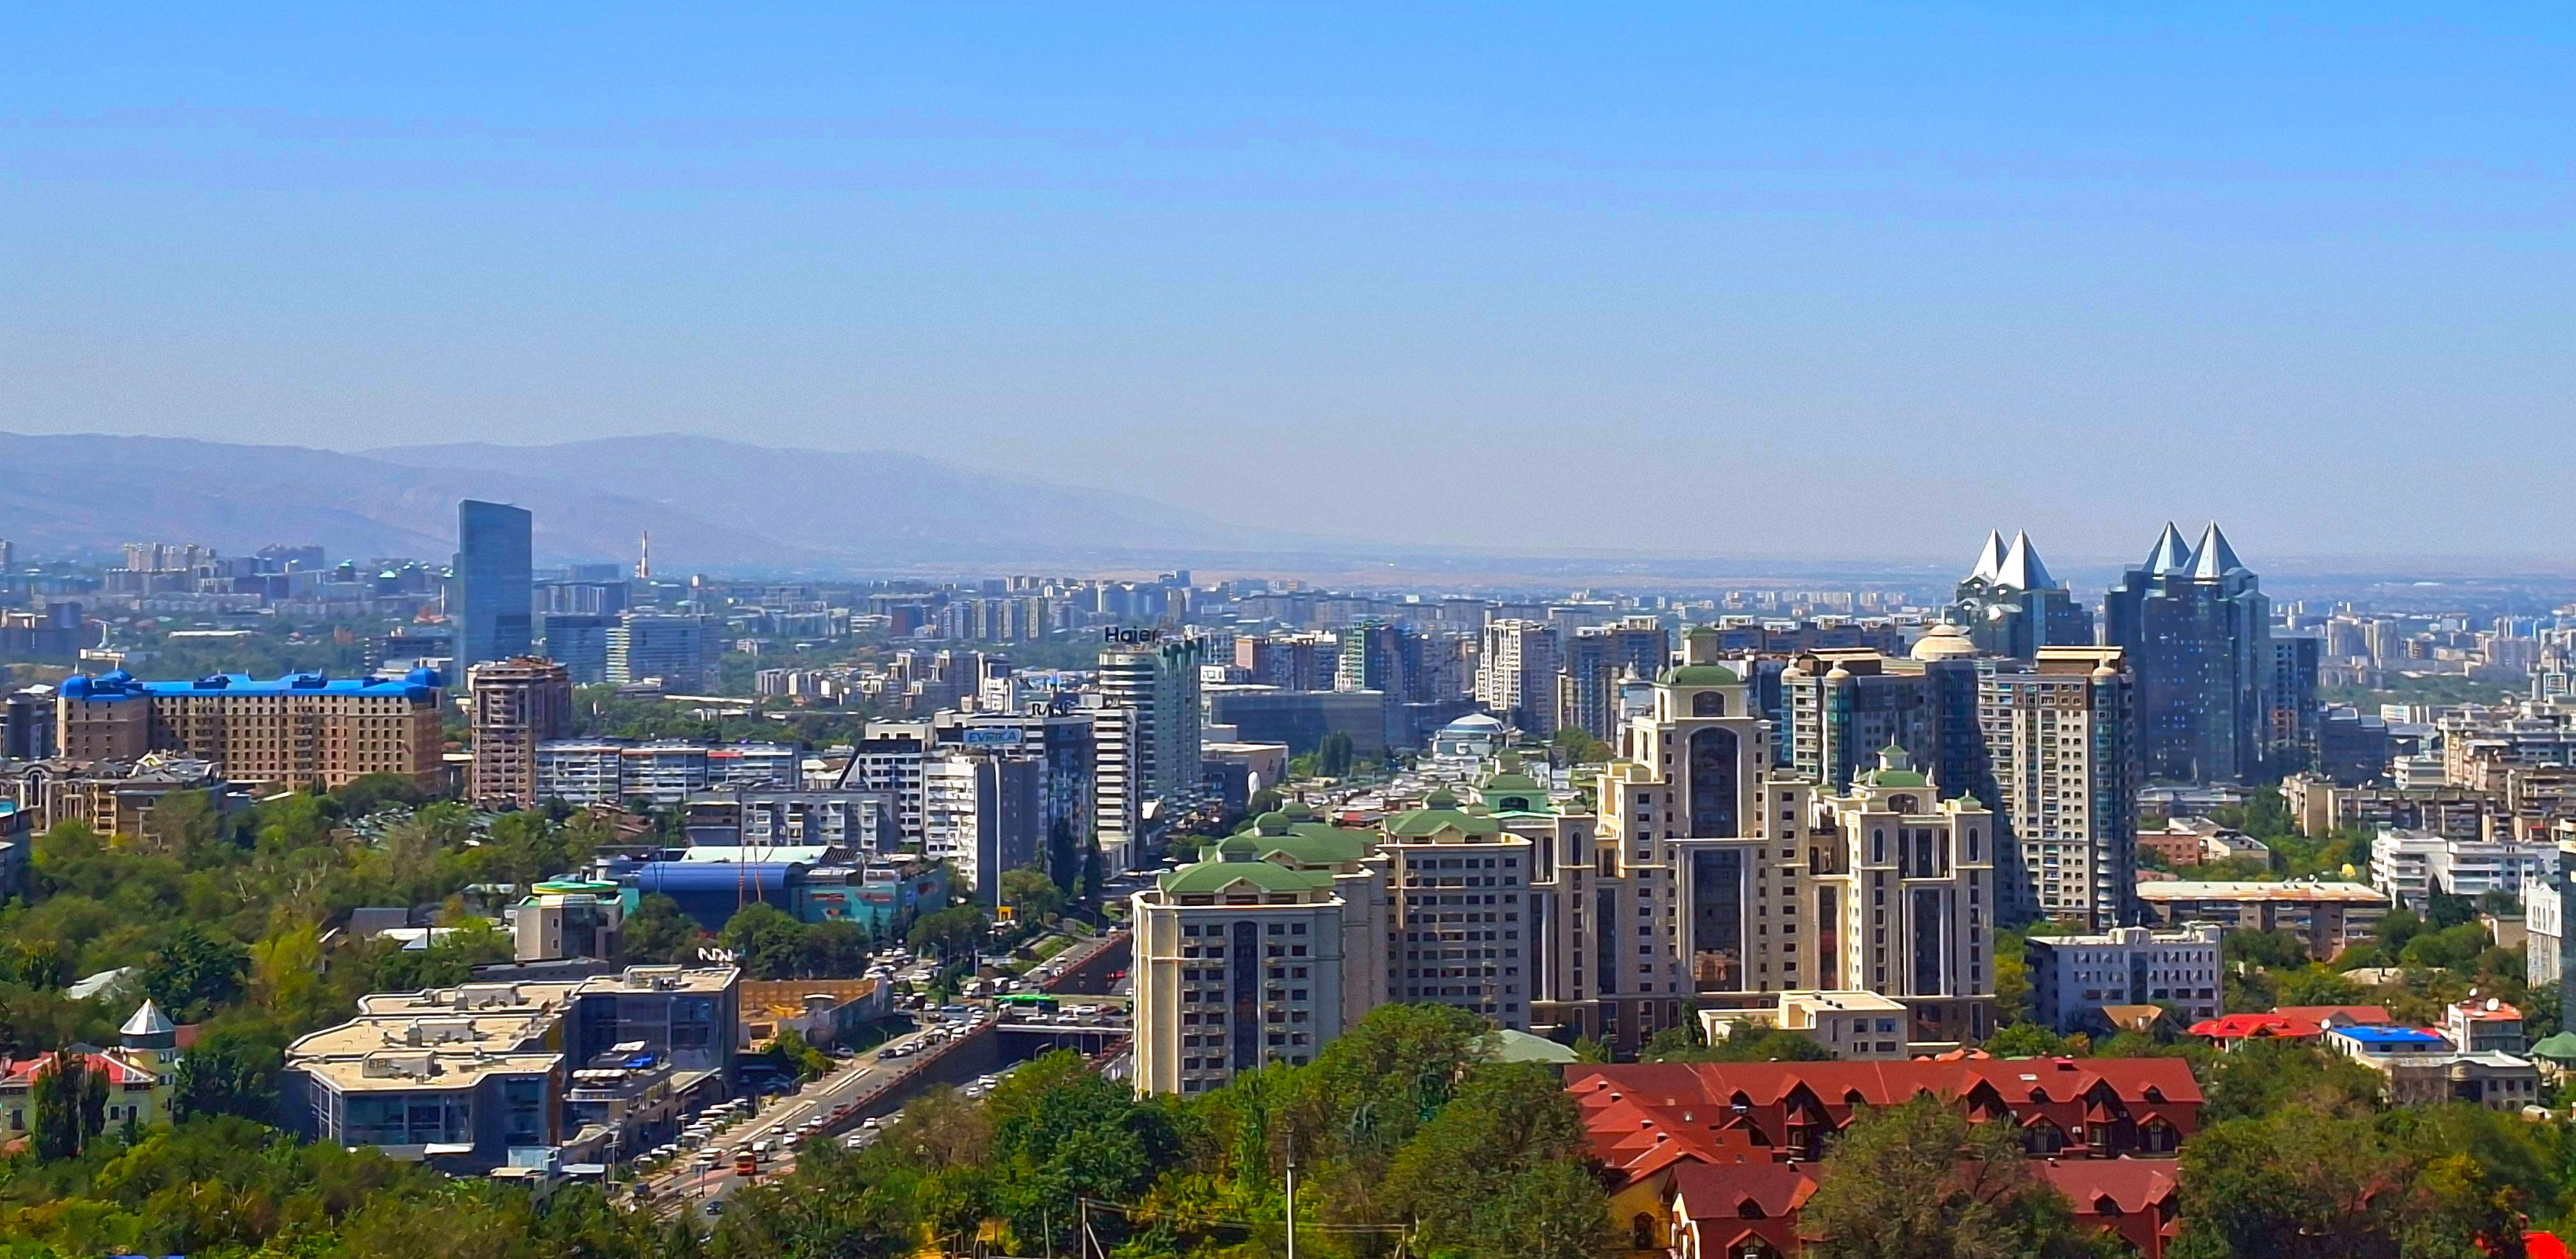
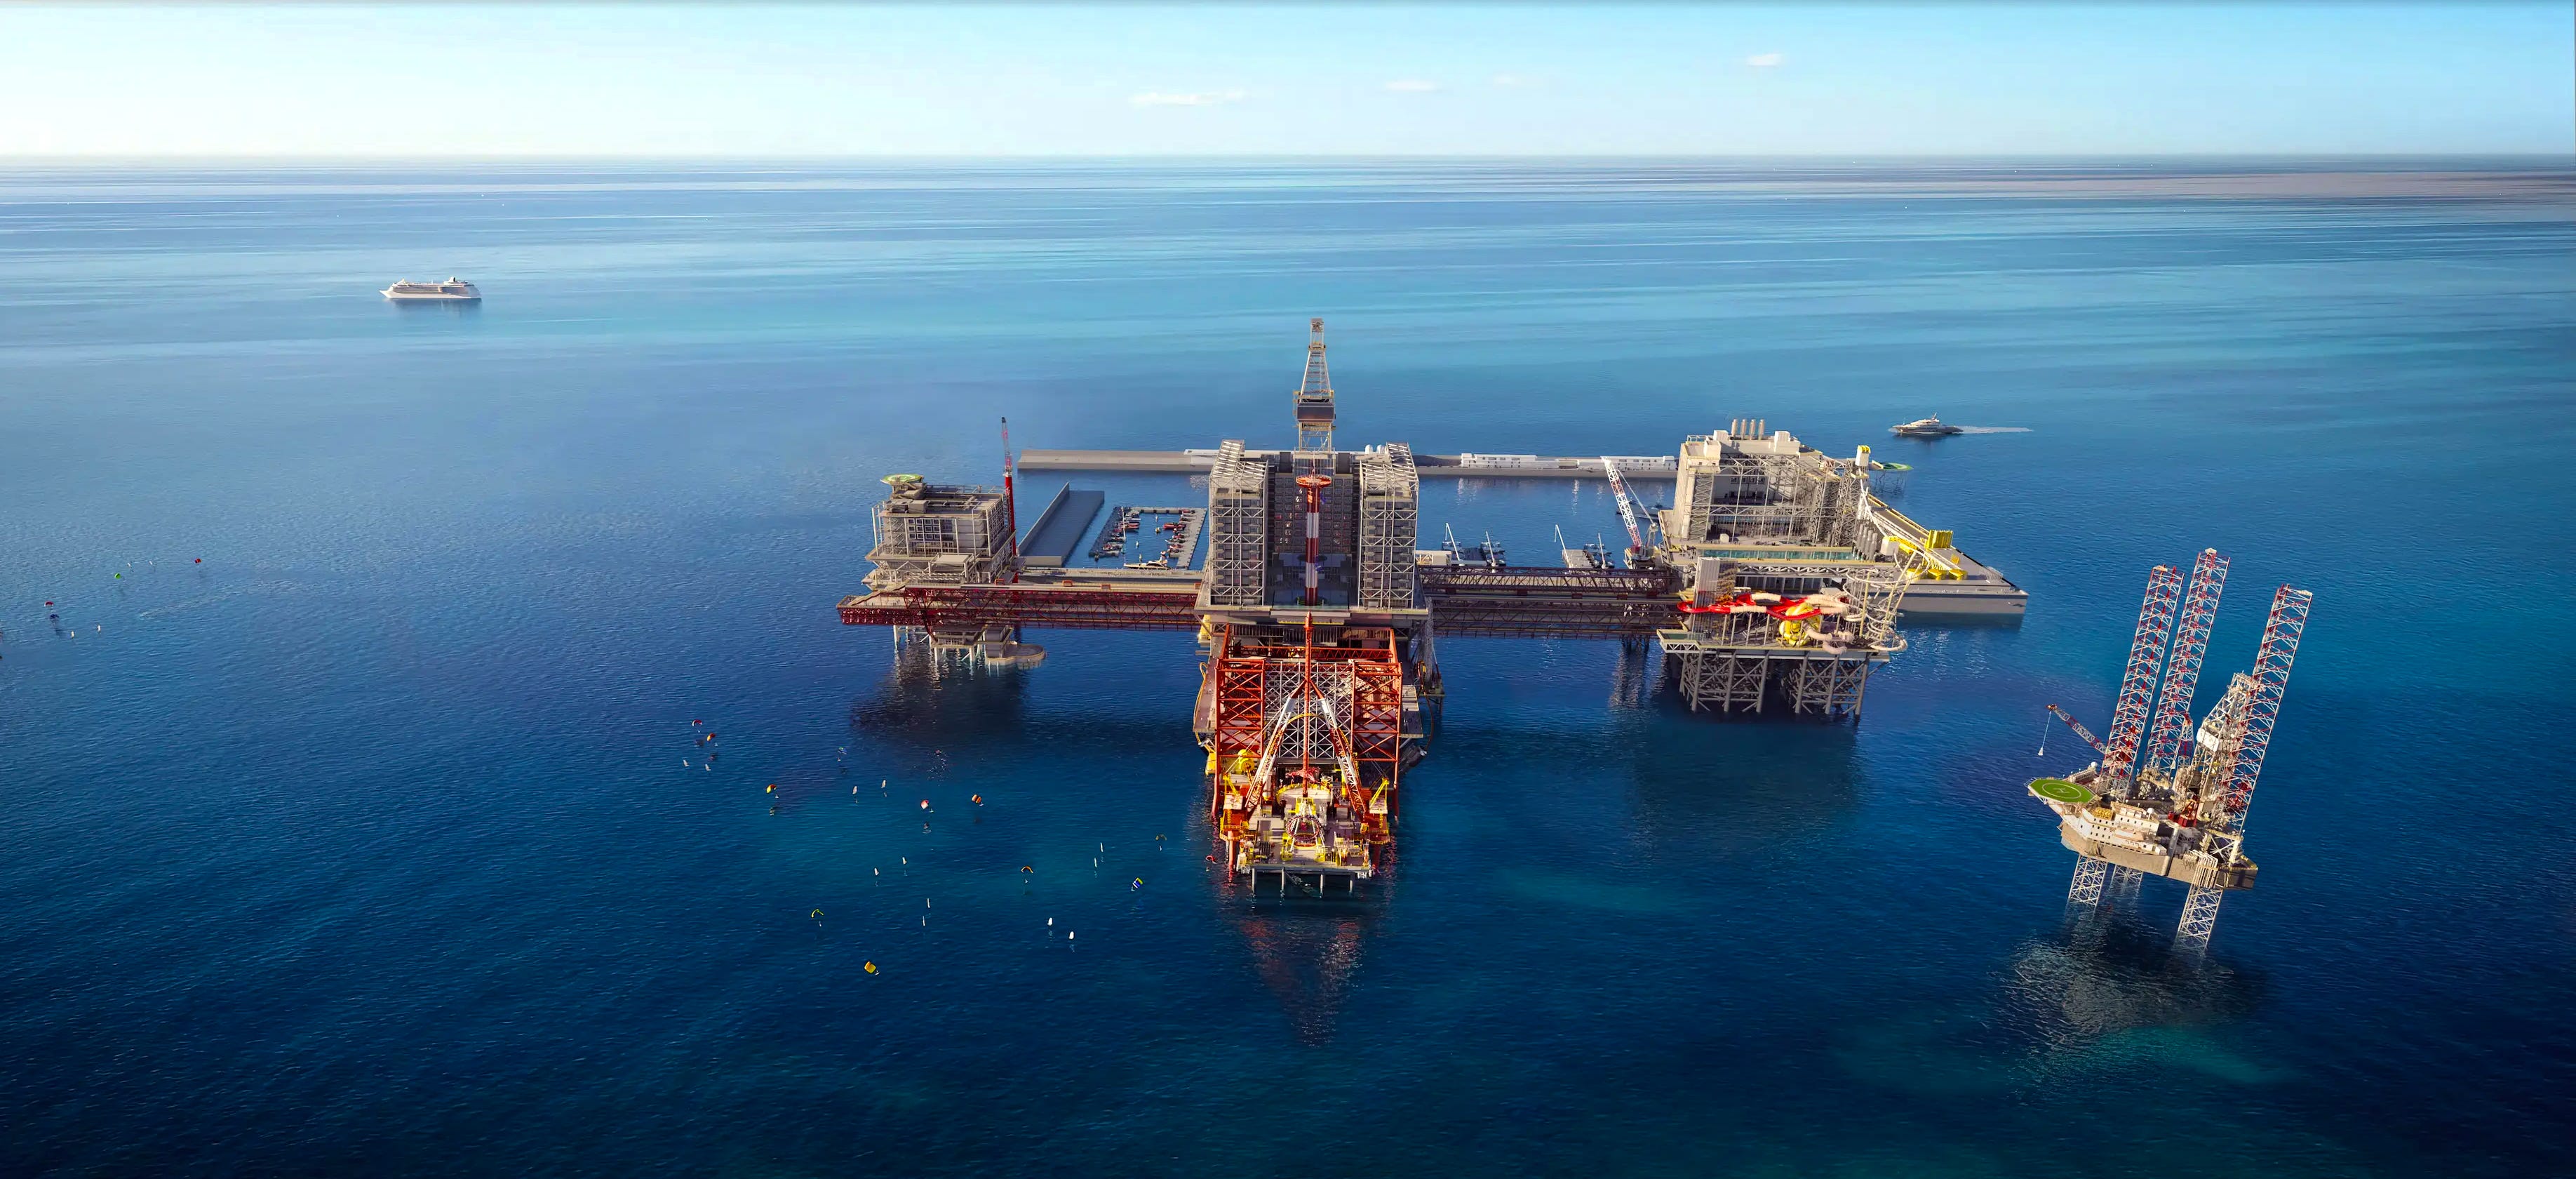
7. United Arab Emirates

Annual Per Capita CO2: 20.13 t
The United Arab Emirates (UAE) is a federation of statelets, several of which - like Abu Dhabi and Dubai - are fully fledged petrostates. Collectively, they are the world’s ninth-largest oil producer, which drives its very high per capita carbon emissions. Dubai’s role as an aviation hub also worsens its ranking significantly. The UAE is adding solar and nuclear to reduce the carbon intensity of its power sector, however.
6. Saudi Arabia
Annual Per Capita CO2: 20.38 t
Saudi Arabia is the second-largest oil producer in the world after the United States, and is increasingly an important gas producer as well. The process emissions from this behemoth fossil fuel industry give it one of the highest per capita emissions levels in the world, despite a relatively large population of 35 million people. Nearly all of its electricity is generated by oil or gas, but it is beginning to develop its colossal solar potential.
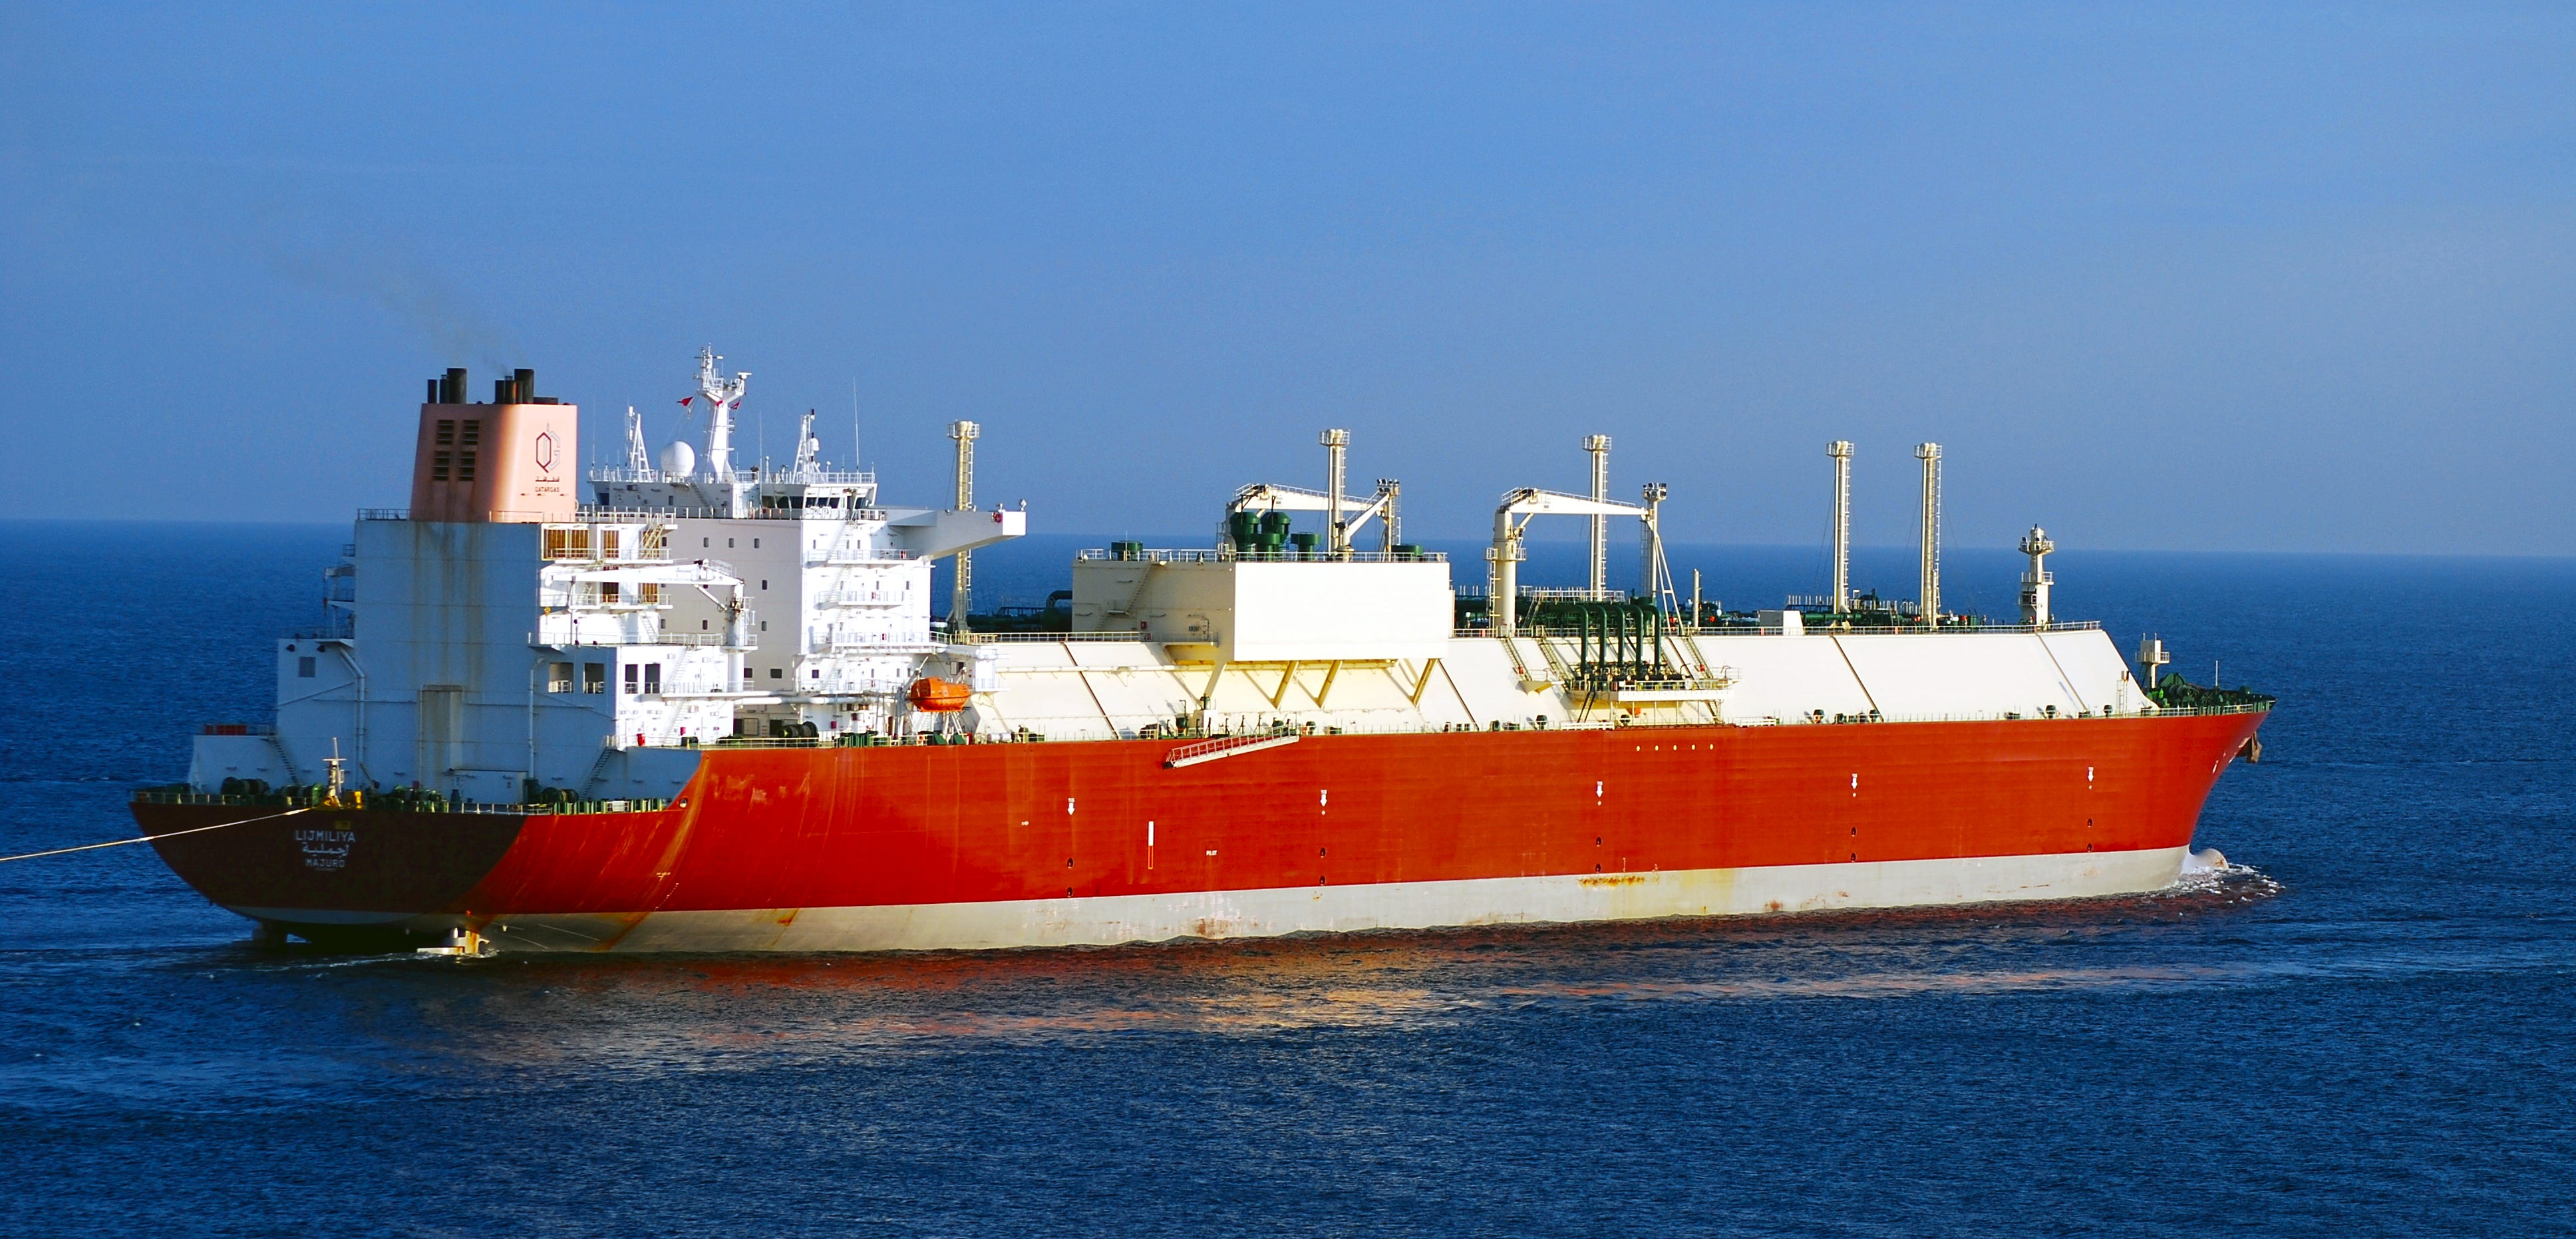
5. Trinidad and Tobago
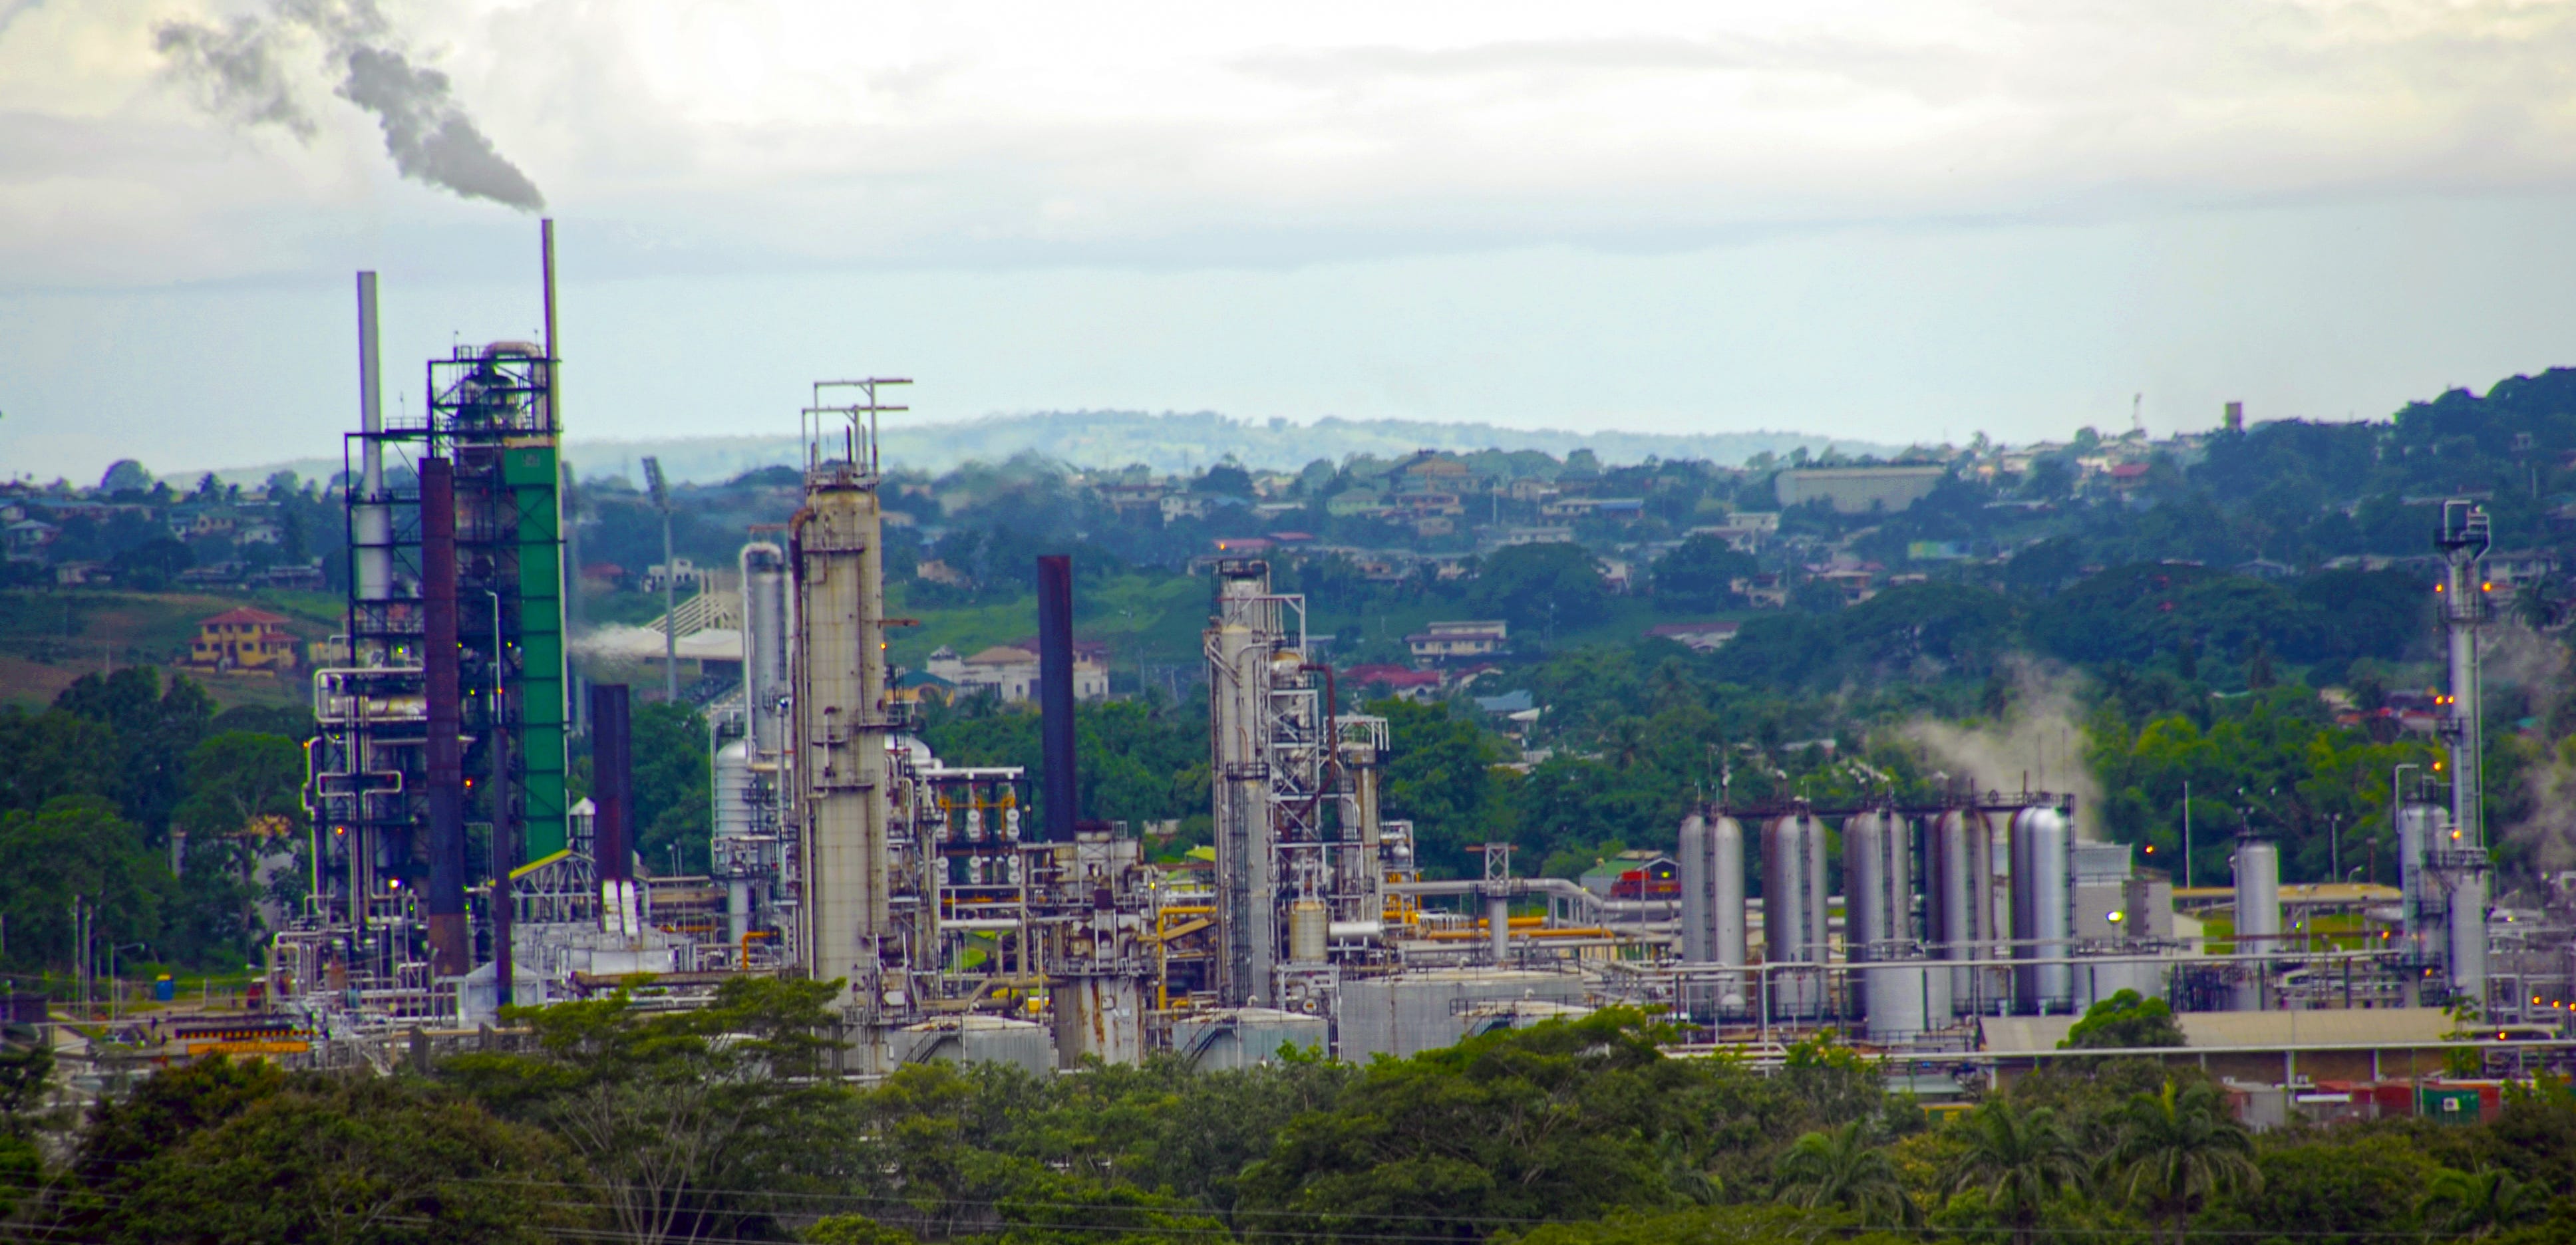
Annual Per Capita CO2: 22.93 t
The Caribbean island nation of Trinidad and Tobago is heavily dependent on the production of oil and gas, which account for 40% of its economy. Most of this comes from offshore gas fields converted to Liquefied Fossil Gas (LFG) and shipped to places like Chile and Europe.
4. Bahrain
Annual Per Capita CO2: 24.27 t
Bahrain is a tiny island nation in the Persian Gulf off the coast of Qatar. It is the fifth-largest producer of fossil gas on a per capita basis, but it keeps most of this production for itself for use in the power sector.
3. Brunei

Annual Per Capita CO2: 26.05 t
Brunei is a tiny petrostate on the island of Borneo with a population of under half a million but the second-highest per capita levels of fossil gas production in the world after Qatar. It mostly supplies East Asian markets like Japan and South Korea via Liquefied Fossil Gas (LFG).
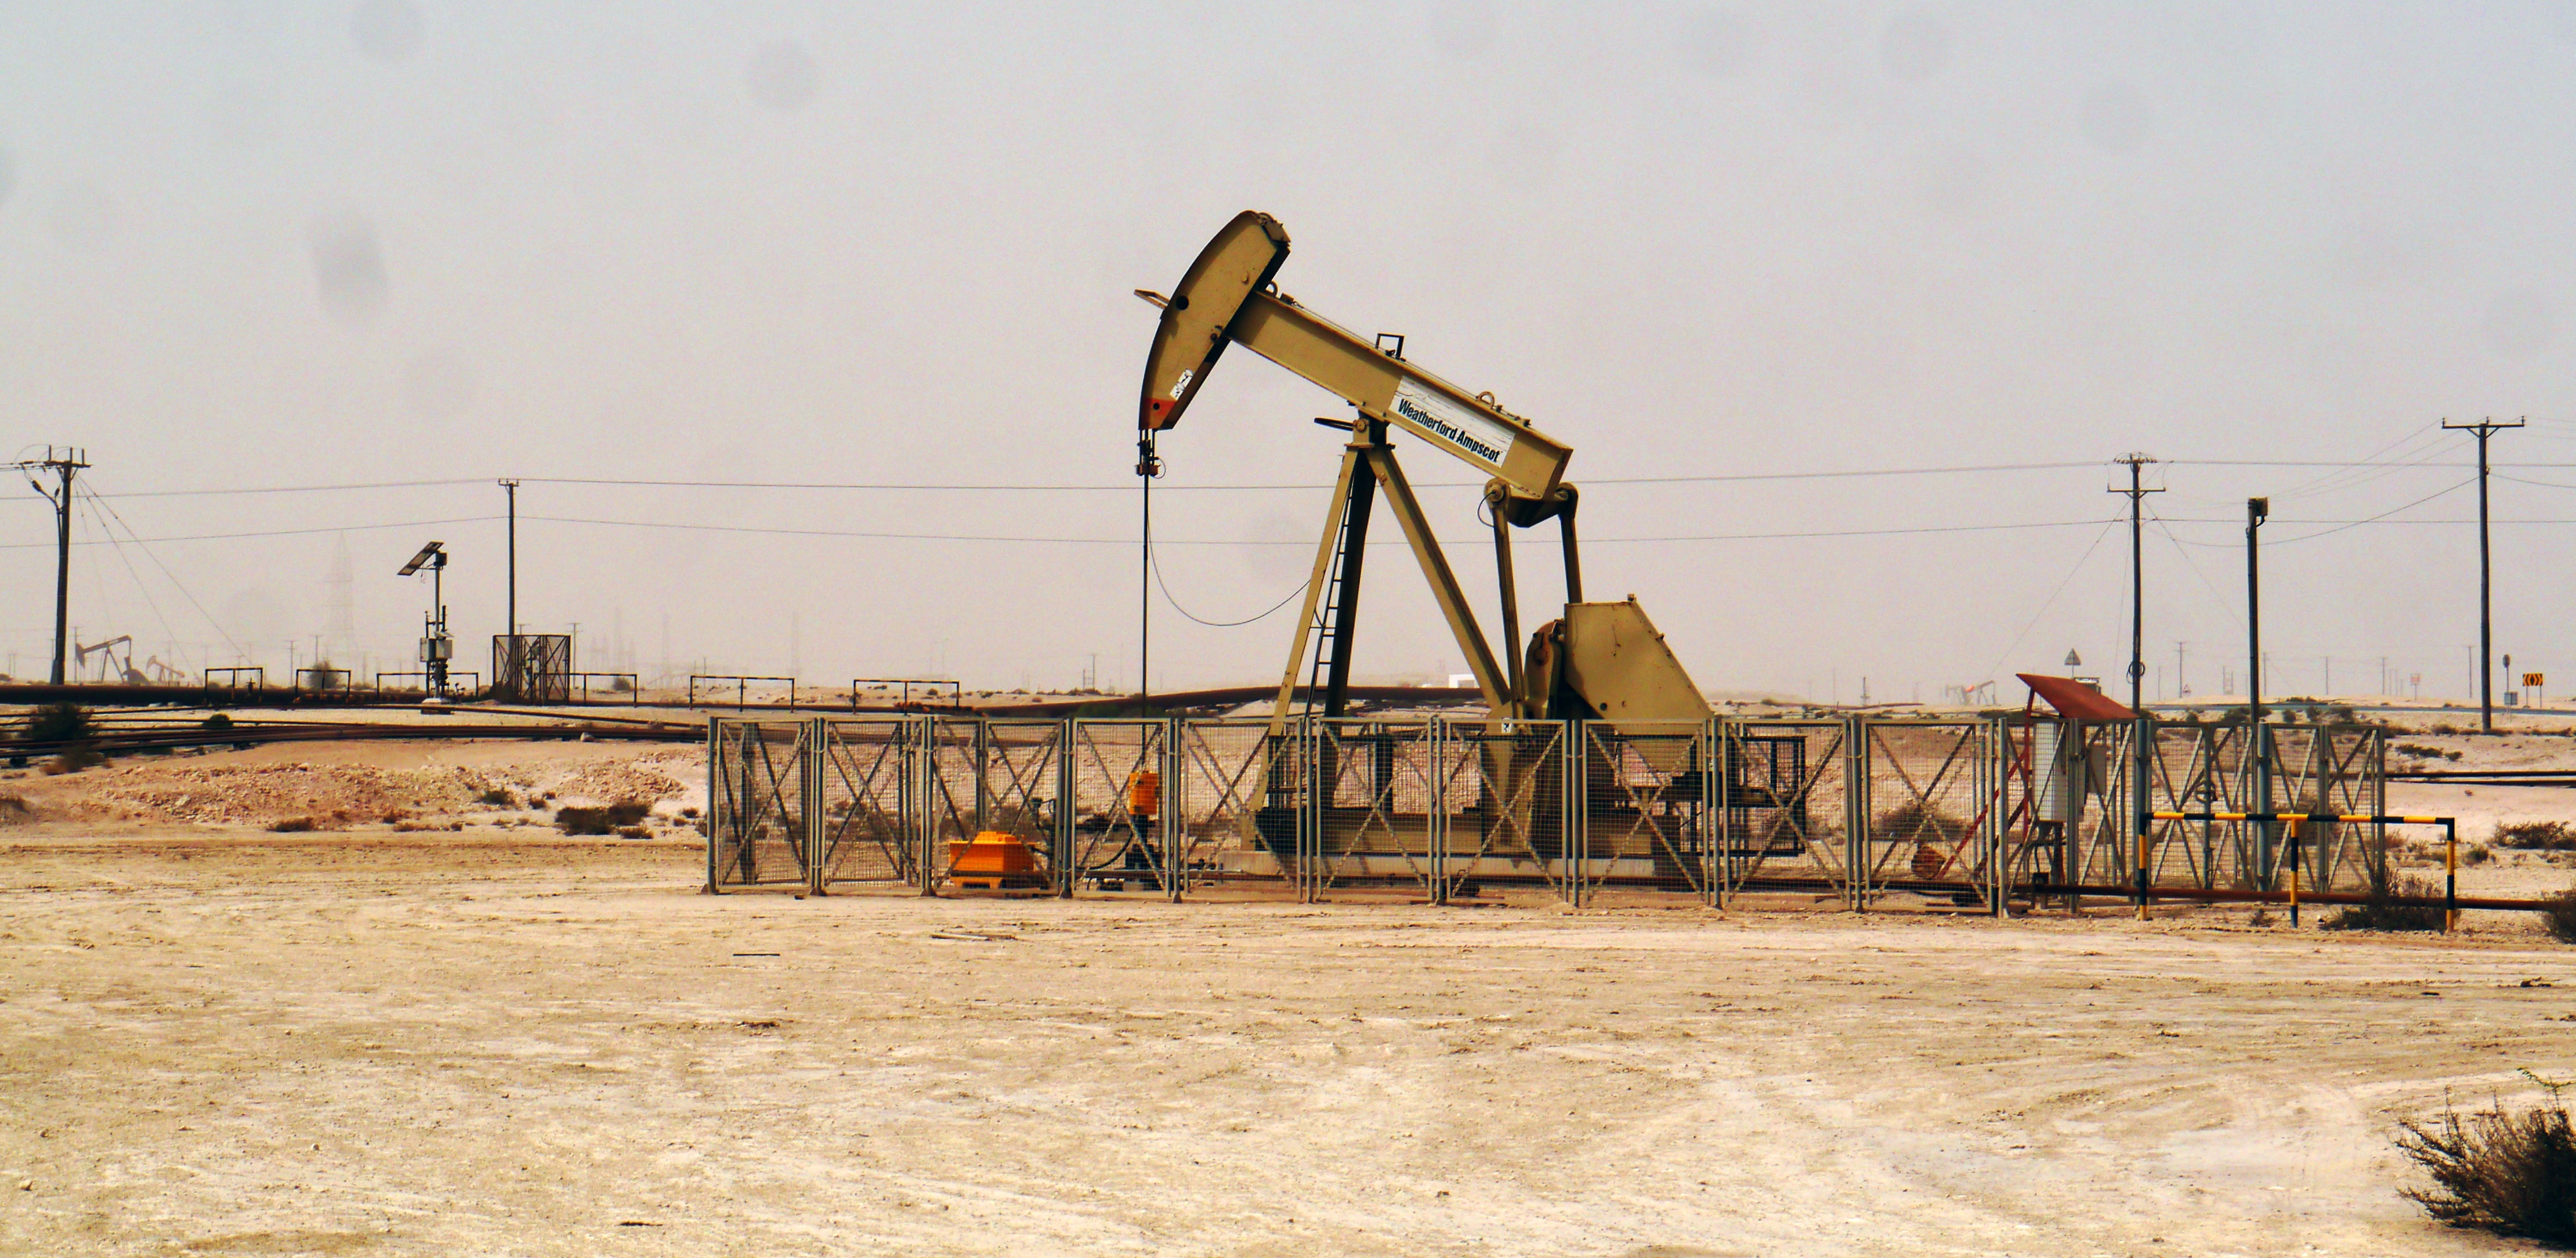
2. Kuwait
Annual Per Capita CO2: 26.25 t
Kuwait has the second-highest levels of oil production per capita, after Guyana, and - despite being smaller than New Jersey - is the tenth-largest oil producer in the world. It gets very little energy from solar, but has several large projects under development.
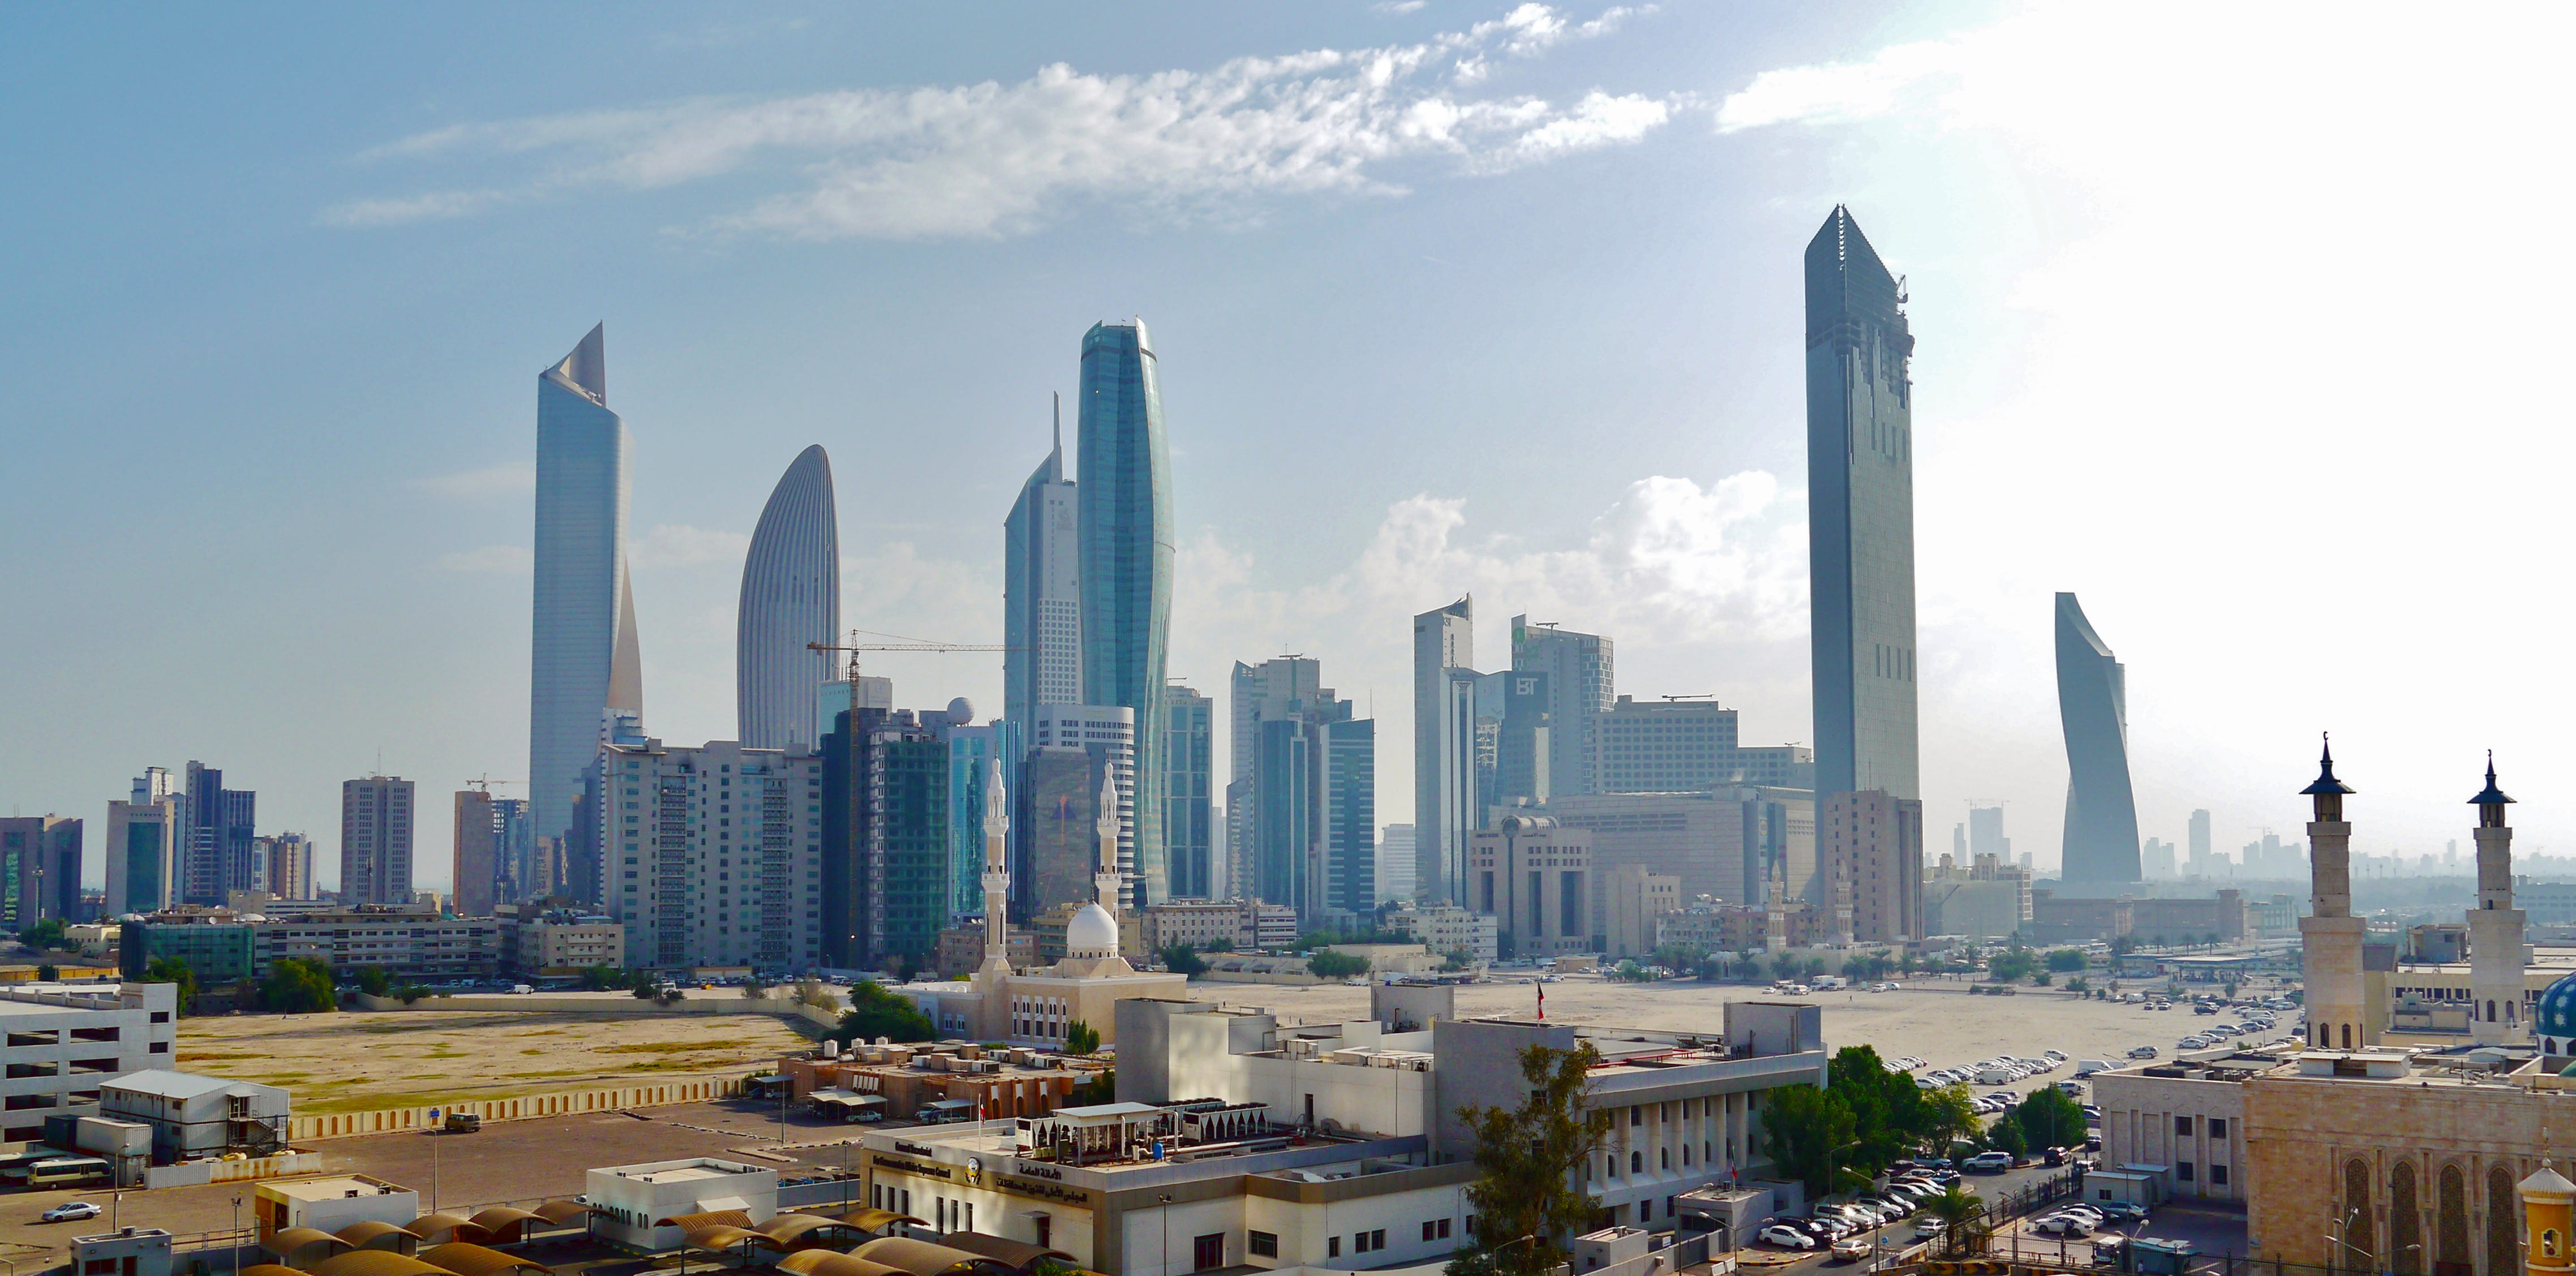
1. Qatar
Annual Per Capita CO2: 41.27 t
Qatar is a tiny nation of only 2.3 million people which has the third largest reserves of fossil gas in the world. Around half of Qatar’s CO2 emissions are linked to its massive Liquefied Fossil Gas (LFG) industry. About 20% of its overall emissions come just from the energy required to cool and pump the gas into specialized tankers for export.
Get Earthview in your inbox:
And consider a paid subscription to access premium content and support the work we do!
These figures exclude exported emissions, only counting fossil fuel emissions in the place where their combustion occurs. This list also excludes non-sovereign polities (e.g., New Caledonia or the Faroe Islands).
Source: https://ourworldindata.org/grapher/co-emissions-per-capita?tab=table